[←][→] ath
| functional annotation | |||||||||||||||||||||||||||||||||||||||||||||||||
| Function | Dihydroxyacetone kinase |


|
|||||||||||||||||||||||||||||||||||||||||||||||
| GO BP |
|
||||||||||||||||||||||||||||||||||||||||||||||||
| GO CC |
|
||||||||||||||||||||||||||||||||||||||||||||||||
| GO MF |
|
||||||||||||||||||||||||||||||||||||||||||||||||
| KEGG | ath00051 [list] [network] Fructose and mannose metabolism (63 genes) |  |
|||||||||||||||||||||||||||||||||||||||||||||||
| ath00561 [list] [network] Glycerolipid metabolism (66 genes) |  |
||||||||||||||||||||||||||||||||||||||||||||||||
| ath01200 [list] [network] Carbon metabolism (273 genes) |  |
||||||||||||||||||||||||||||||||||||||||||||||||
| Protein | NP_001322460.1 NP_175276.3 | ||||||||||||||||||||||||||||||||||||||||||||||||
| BLAST | NP_001322460.1 NP_175276.3 | ||||||||||||||||||||||||||||||||||||||||||||||||
| Orthologous | [Ortholog page] dhbK (sly) DHBK (gma) AT3G17770 (ath) LOC4333926 (osa) LOC7454010 (ppo) LOC18105587 (ppo) LOC25496664 (mtr) LOC100801639 (gma) LOC103833003 (bra) LOC103869653 (bra) LOC123087076 (tae) LOC123090889 (tae) LOC123095912 (tae) LOC123447541 (hvu) | ||||||||||||||||||||||||||||||||||||||||||||||||
| Subcellular localization wolf |
|
||||||||||||||||||||||||||||||||||||||||||||||||
| Subcellular localization TargetP |
|
||||||||||||||||||||||||||||||||||||||||||||||||
| Gene coexpression | |||||||||||||||||||||||||||||||||||||||||||||||||
| Network*for coexpressed genes |
|
||||||||||||||||||||||||||||||||||||||||||||||||
|---|---|---|---|---|---|---|---|---|---|---|---|---|---|---|---|---|---|---|---|---|---|---|---|---|---|---|---|---|---|---|---|---|---|---|---|---|---|---|---|---|---|---|---|---|---|---|---|---|---|
| Coexpressed gene list |
[Coexpressed gene list for AT1G48430] | ||||||||||||||||||||||||||||||||||||||||||||||||
| Gene expression | |||||||||||||||||||||||||||||||||||||||||||||||||
| All samples | [Expression pattern for all samples] | ||||||||||||||||||||||||||||||||||||||||||||||||
| AtGenExpress* (Development) |
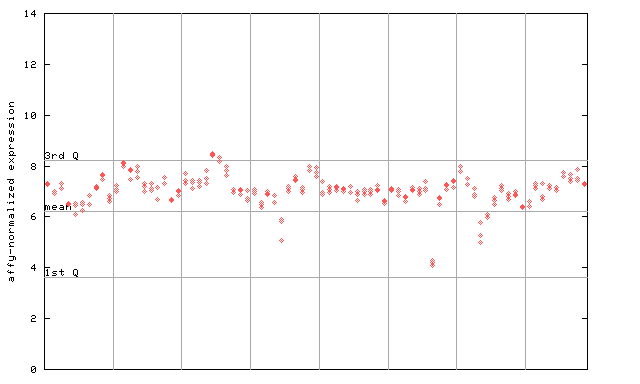
261294_at

X axis is samples (pdf file), and Y axis is log2-expression. |
||||||||||||||||||||||||||||||||||||||||||||||||
| AtGenExpress* (Stress) |
261294_at

X axis is samples (pdf file), and Y axis is log2-expression. |
||||||||||||||||||||||||||||||||||||||||||||||||
| AtGenExpress* (Hormone) |
261294_at

X axis is samples (xls file), and Y axis is log-expression. |
||||||||||||||||||||||||||||||||||||||||||||||||
| Link to other DBs | ||
| Entrez Gene ID | 841264 |


|
| Refseq ID (protein) | NP_001322460.1 |  |
| NP_175276.3 |  |
|
The preparation time of this page was 0.1 [sec].


