[←][→] ath
| functional annotation | |||||||||||||||||||||||||||||||||||||||||||||||||||||
| Function | CURVATURE THYLAKOID protein |


|
|||||||||||||||||||||||||||||||||||||||||||||||||||
| GO BP |
|
||||||||||||||||||||||||||||||||||||||||||||||||||||
| GO CC |
|
||||||||||||||||||||||||||||||||||||||||||||||||||||
| GO MF |
|
||||||||||||||||||||||||||||||||||||||||||||||||||||
| KEGG | |||||||||||||||||||||||||||||||||||||||||||||||||||||
| Protein | NP_001031173.1 NP_001077703.1 NP_001322106.1 NP_564603.1 | ||||||||||||||||||||||||||||||||||||||||||||||||||||
| BLAST | NP_001031173.1 NP_001077703.1 NP_001322106.1 NP_564603.1 | ||||||||||||||||||||||||||||||||||||||||||||||||||||
| Orthologous | [Ortholog page] LOC4327018 (osa) LOC7470562 (ppo) LOC7483535 (ppo) LOC25491409 (mtr) LOC100305776 (gma) LOC100306487 (gma) LOC101249276 (sly) LOC103871228 (bra) LOC123062125 (tae) LOC123070851 (tae) LOC123079239 (tae) LOC123444465 (hvu) | ||||||||||||||||||||||||||||||||||||||||||||||||||||
| Subcellular localization wolf |
|
||||||||||||||||||||||||||||||||||||||||||||||||||||
| Subcellular localization TargetP |
|
||||||||||||||||||||||||||||||||||||||||||||||||||||
| Gene coexpression | |||||||||||||||||||||||||||||||||||||||||||||||||||||
| Network*for coexpressed genes |
|
||||||||||||||||||||||||||||||||||||||||||||||||||||
|---|---|---|---|---|---|---|---|---|---|---|---|---|---|---|---|---|---|---|---|---|---|---|---|---|---|---|---|---|---|---|---|---|---|---|---|---|---|---|---|---|---|---|---|---|---|---|---|---|---|---|---|---|---|
| Coexpressed gene list |
[Coexpressed gene list for AT1G52220] | ||||||||||||||||||||||||||||||||||||||||||||||||||||
| Gene expression | |||||||||||||||||||||||||||||||||||||||||||||||||||||
| All samples | [Expression pattern for all samples] | ||||||||||||||||||||||||||||||||||||||||||||||||||||
| AtGenExpress* (Development) |
259838_at
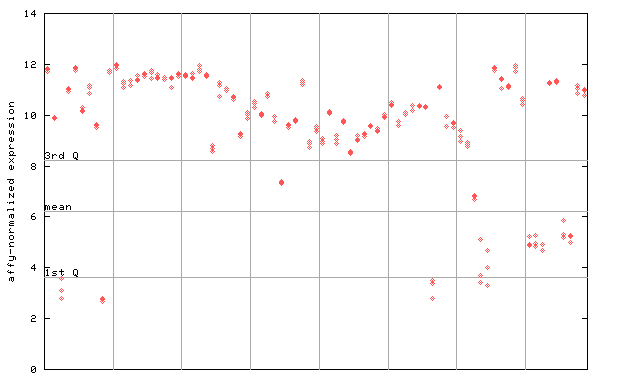
X axis is samples (pdf file), and Y axis is log2-expression. |
||||||||||||||||||||||||||||||||||||||||||||||||||||
| AtGenExpress* (Stress) |
259838_at
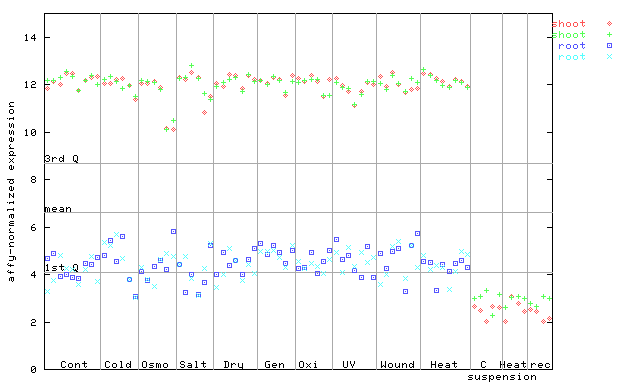
X axis is samples (pdf file), and Y axis is log2-expression. |
||||||||||||||||||||||||||||||||||||||||||||||||||||
| AtGenExpress* (Hormone) |
259838_at
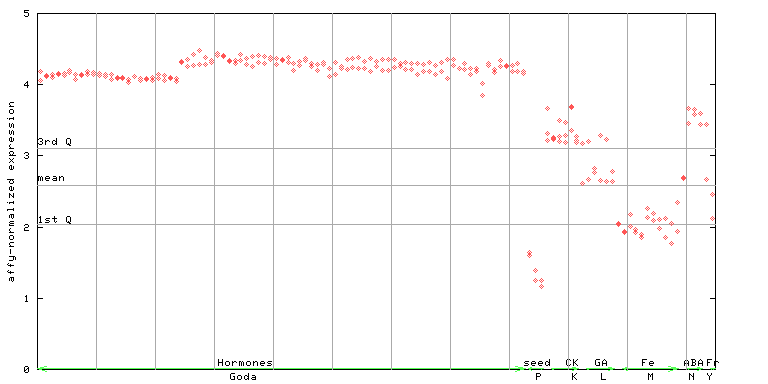
X axis is samples (xls file), and Y axis is log-expression. |
||||||||||||||||||||||||||||||||||||||||||||||||||||


")
")
| Link to other DBs | ||
| Entrez Gene ID | 841652 |
|
| Refseq ID (protein) | NP_001031173.1 | |
| NP_001077703.1 | |
|
| NP_001322106.1 | |
|
| NP_564603.1 | |
|
The preparation time of this page was 0.1 [sec].