[←][→] ath
| functional annotation | ||||||||||||||||||||||||||||||||||||||||||||||||||
| Function | BES1/BZR1 homolog 4 |


|
||||||||||||||||||||||||||||||||||||||||||||||||
| GO BP |
|
|||||||||||||||||||||||||||||||||||||||||||||||||
| GO CC |
|
|||||||||||||||||||||||||||||||||||||||||||||||||
| GO MF |
|
|||||||||||||||||||||||||||||||||||||||||||||||||
| KEGG | ||||||||||||||||||||||||||||||||||||||||||||||||||
| Protein | NP_565187.1 | |||||||||||||||||||||||||||||||||||||||||||||||||
| BLAST | NP_565187.1 | |||||||||||||||||||||||||||||||||||||||||||||||||
| Orthologous | [Ortholog page] BEH3 (ath) LOC4327076 (osa) LOC4341270 (osa) LOC7455933 (ppo) LOC7470190 (ppo) LOC11410403 (mtr) LOC11415407 (mtr) LOC18095445 (ppo) LOC18103183 (ppo) LOC18109687 (ppo) BES1-11 (gma) BES1-9 (gma) BES1-10 (gma) BES1-12 (gma) LOC101246895 (sly) LOC101247043 (sly) LOC101250766 (sly) LOC103832348 (bra) LOC103853143 (bra) LOC103856918 (bra) LOC103861022 (bra) LOC123060608 (tae) LOC123069166 (tae) LOC123077689 (tae) LOC123147966 (tae) LOC123161808 (tae) LOC123167138 (tae) LOC123410116 (hvu) LOC123443097 (hvu) | |||||||||||||||||||||||||||||||||||||||||||||||||
| Subcellular localization wolf |
|
|||||||||||||||||||||||||||||||||||||||||||||||||
| Subcellular localization TargetP |
|
|||||||||||||||||||||||||||||||||||||||||||||||||
| Gene coexpression | ||||||||||||||||||||||||||||||||||||||||||||||||||
| Network*for coexpressed genes |
|
|||||||||||||||||||||||||||||||||||||||||||||||||
|---|---|---|---|---|---|---|---|---|---|---|---|---|---|---|---|---|---|---|---|---|---|---|---|---|---|---|---|---|---|---|---|---|---|---|---|---|---|---|---|---|---|---|---|---|---|---|---|---|---|---|
| Coexpressed gene list |
[Coexpressed gene list for BEH4] | |||||||||||||||||||||||||||||||||||||||||||||||||
| Gene expression | ||||||||||||||||||||||||||||||||||||||||||||||||||
| All samples | [Expression pattern for all samples] | |||||||||||||||||||||||||||||||||||||||||||||||||
| AtGenExpress* (Development) |
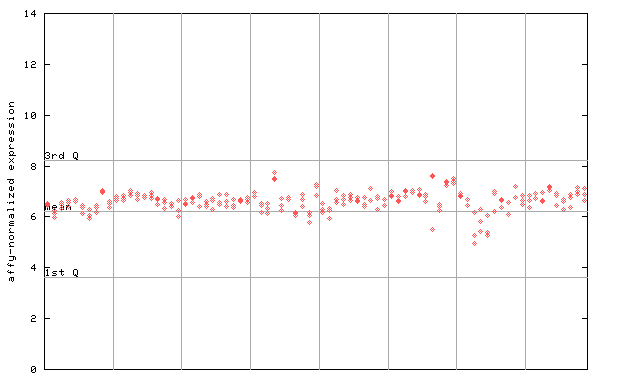
264248_at

X axis is samples (pdf file), and Y axis is log2-expression. |
|||||||||||||||||||||||||||||||||||||||||||||||||
| AtGenExpress* (Stress) |
264248_at

X axis is samples (pdf file), and Y axis is log2-expression. |
|||||||||||||||||||||||||||||||||||||||||||||||||
| AtGenExpress* (Hormone) |
264248_at

X axis is samples (xls file), and Y axis is log-expression. |
|||||||||||||||||||||||||||||||||||||||||||||||||
| Link to other DBs | ||
| Entrez Gene ID | 844206 |


|
| Refseq ID (protein) | NP_565187.1 |  |
The preparation time of this page was 0.1 [sec].


