[←][→] ath
| functional annotation | |||||||||||||||||||||||||||||||||||||||||
| Function | EXS (ERD1/XPR1/SYG1) family protein |


|
|||||||||||||||||||||||||||||||||||||||
| GO BP |
|
||||||||||||||||||||||||||||||||||||||||
| GO CC |
|
||||||||||||||||||||||||||||||||||||||||
| GO MF |
|
||||||||||||||||||||||||||||||||||||||||
| KEGG | |||||||||||||||||||||||||||||||||||||||||
| Protein | NP_001324493.1 NP_178425.2 | ||||||||||||||||||||||||||||||||||||||||
| BLAST | NP_001324493.1 NP_178425.2 | ||||||||||||||||||||||||||||||||||||||||
| Orthologous | [Ortholog page] AT2G03240 (ath) AT2G03250 (ath) SHB1 (ath) AT1G14040 (ath) AT1G26730 (ath) AT1G35350 (ath) LOC7460709 (ppo) LOC7481563 (ppo) LOC7481567 (ppo) LOC18102643 (ppo) PHO1-H7 (gma) PHO1-H9 (gma) PHO1-H10 (gma) PHO1-H11 (gma) PHO1-H2 (gma) LOC103834877 (bra) LOC103835608 (bra) LOC103839415 (bra) LOC103839416 (bra) LOC103839418 (bra) LOC103843006 (bra) LOC103843007 (bra) LOC103853960 (bra) LOC103872096 (bra) LOC103872097 (bra) LOC103872215 (bra) LOC103875437 (bra) LOC103875439 (bra) LOC103875442 (bra) | ||||||||||||||||||||||||||||||||||||||||
| Subcellular localization wolf |
|
||||||||||||||||||||||||||||||||||||||||
| Subcellular localization TargetP |
|
||||||||||||||||||||||||||||||||||||||||
| Gene coexpression | |||||||||||||||||||||||||||||||||||||||||
| Network*for coexpressed genes |
|
||||||||||||||||||||||||||||||||||||||||
|---|---|---|---|---|---|---|---|---|---|---|---|---|---|---|---|---|---|---|---|---|---|---|---|---|---|---|---|---|---|---|---|---|---|---|---|---|---|---|---|---|---|
| Coexpressed gene list |
[Coexpressed gene list for AT2G03260] | ||||||||||||||||||||||||||||||||||||||||
| Gene expression | |||||||||||||||||||||||||||||||||||||||||
| All samples | [Expression pattern for all samples] | ||||||||||||||||||||||||||||||||||||||||
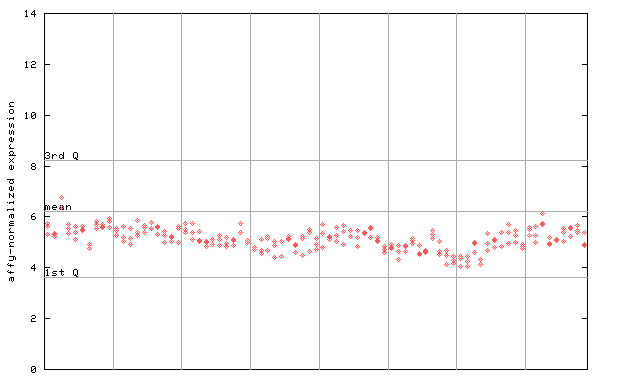
| AtGenExpress* (Development) |
266731_at

X axis is samples (pdf file), and Y axis is log2-expression. |
||||||||||||||||||||||||||||||||||||||||
| AtGenExpress* (Stress) |
266731_at

X axis is samples (pdf file), and Y axis is log2-expression. |
||||||||||||||||||||||||||||||||||||||||
| AtGenExpress* (Hormone) |
266731_at

X axis is samples (xls file), and Y axis is log-expression. |
||||||||||||||||||||||||||||||||||||||||
| Link to other DBs | ||
| Entrez Gene ID | 814855 |


|
| Refseq ID (protein) | NP_001324493.1 |  |
| NP_178425.2 |  |
|
The preparation time of this page was 0.1 [sec].

