| functional annotation |
| Function |
G protein alpha subunit 1 |


|
| GO BP |
|
GO:0003376 [list] [network] sphingosine-1-phosphate receptor signaling pathway
|
(1 genes)
|
IMP
|
 |
|
GO:0019236 [list] [network] response to pheromone
|
(2 genes)
|
IMP
|
 |
|
GO:0006571 [list] [network] tyrosine biosynthetic process
|
(5 genes)
|
IMP
|
 |
|
GO:0009094 [list] [network] L-phenylalanine biosynthetic process
|
(7 genes)
|
IMP
|
 |
|
GO:0010244 [list] [network] response to low fluence blue light stimulus by blue low-fluence system
|
(9 genes)
|
IMP
|
 |
|
GO:0007186 [list] [network] G protein-coupled receptor signaling pathway
|
(20 genes)
|
IMP
|
 |
|
GO:0009785 [list] [network] blue light signaling pathway
|
(24 genes)
|
IMP
|
 |
|
GO:0090333 [list] [network] regulation of stomatal closure
|
(39 genes)
|
IMP
|
 |
|
GO:0009740 [list] [network] gibberellic acid mediated signaling pathway
|
(42 genes)
|
IMP
|
 |
|
GO:0072593 [list] [network] reactive oxygen species metabolic process
|
(47 genes)
|
IMP
|
 |
|
GO:0010027 [list] [network] thylakoid membrane organization
|
(49 genes)
|
IMP
|
 |
|
GO:0009789 [list] [network] positive regulation of abscisic acid-activated signaling pathway
|
(53 genes)
|
IMP
|
 |
|
GO:0009749 [list] [network] response to glucose
|
(64 genes)
|
IGI
|
 |
|
GO:0042127 [list] [network] regulation of cell population proliferation
|
(93 genes)
|
IMP
|
 |
|
GO:0009845 [list] [network] seed germination
|
(99 genes)
|
IMP
|
 |
|
GO:0010119 [list] [network] regulation of stomatal movement
|
(105 genes)
|
IMP
TAS
|
 |
|
GO:0008219 [list] [network] cell death
|
(126 genes)
|
IMP
|
 |
|
GO:0009738 [list] [network] abscisic acid-activated signaling pathway
|
(159 genes)
|
IMP
TAS
|
 |
|
| GO CC |
|
| GO MF |
|
| KEGG |
|
|
| Protein |
NP_001325056.1
NP_180198.1
|
| BLAST |
NP_001325056.1
NP_180198.1
|
| Orthologous |
[Ortholog page]
GPA1 (sly)
GPA1 (gma)
GPA2 (gma)
LOC4338448 (osa)
LOC7476677 (ppo)
LOC7491983 (ppo)
LOC11432413 (mtr)
LOC100781223 (gma)
LOC100800120 (gma)
LOC103842156 (bra)
LOC123164183 (tae)
LOC123409660 (hvu)
|
Subcellular
localization
wolf |
|
cyto 4,
mito 2,
cyto_E.R. 2,
plas 1,
cyto_mito 1,
golg_plas 1
|
(predict for NP_001325056.1)
|
|
cyto 4,
mito 2,
cyto_E.R. 2,
plas 1,
cyto_mito 1,
golg_plas 1
|
(predict for NP_180198.1)
|
|
Subcellular
localization
TargetP |
|
other 8
|
(predict for NP_001325056.1)
|
|
other 8
|
(predict for NP_180198.1)
|
|
| Gene coexpression |
Network*for
coexpressed
genes |
| KEGG* ID |
Title |
#genes |
Link to the KEGG* map
(Multiple genes) |
| ath03015 |
mRNA surveillance pathway |
2 |
 |
Genes directly connected with GP ALPHA 1 on the network
| coex z* |
Locus |
Function* |
CoexViewer |
Entrez Gene ID* |
| 6.7 |
TOPP1 |
type one protein phosphatase 1 |
[detail] |
817489 |
| 6.5 |
AT3G12760 |
defective in cullin neddylation protein |
[detail] |
820458 |
| 5.7 |
VAMP724 |
vesicle-associated membrane protein 724 |
[detail] |
827258 |
| 4.8 |
AT3G19100 |
Protein kinase superfamily protein |
[detail] |
821445 |
|
Coexpressed
gene list |
[Coexpressed gene list for GP ALPHA 1]
|
| Gene expression |
| All samples |
[Expression pattern for all samples]
|
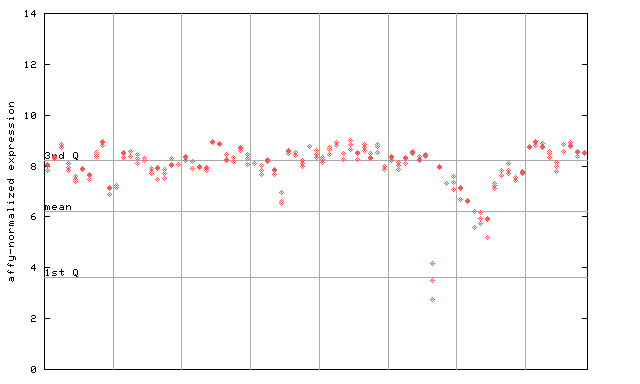
AtGenExpress*
(Development) |
267375_at

X axis is samples (pdf file), and Y axis is log2-expression.
"1st Q", "mean" and "3rd Q" indecate the values for all genes on a GeneChip. Q: quartile.
|
AtGenExpress*
(Stress) |
267375_at

X axis is samples (pdf file), and Y axis is log2-expression.
|
AtGenExpress*
(Hormone) |
267375_at

X axis is samples (xls file), and Y axis is log-expression.
|


