[←][→] ath
| functional annotation | |||||||||||||||||||||||||||||||||||||||||||||||||
| Function | lipid transfer protein 2 |


|
|||||||||||||||||||||||||||||||||||||||||||||||
| GO BP |
|
||||||||||||||||||||||||||||||||||||||||||||||||
| GO CC |
|
||||||||||||||||||||||||||||||||||||||||||||||||
| GO MF |
|
||||||||||||||||||||||||||||||||||||||||||||||||
| KEGG | |||||||||||||||||||||||||||||||||||||||||||||||||
| Protein | NP_181387.1 | ||||||||||||||||||||||||||||||||||||||||||||||||
| BLAST | NP_181387.1 | ||||||||||||||||||||||||||||||||||||||||||||||||
| Orthologous | [Ortholog page] LOC542871 (tae) LOC543095 (tae) LOC543420 (tae) LE16 (sly) TSW12 (sly) LOC606362 (tae) LOC606363 (tae) LOC606364 (tae) ltpg1 (sly) LOC778422 (tae) LOC780572 (tae) LOC780599 (tae) LTP (ath) AT2G18370 (ath) LP1 (ath) LTP5 (ath) AT4G33355 (ath) LTP4 (ath) LTP3 (ath) LOC4349601 (osa) LOC4349602 (osa) LOC4349605 (osa) LOC4350386 (osa) LOC4351315 (osa) LOC4351317 (osa) LOC4351318 (osa) LOC4351319 (osa) LOC4351320 (osa) LOC7466252 (ppo) LOC7472470 (ppo) LOC7482588 (ppo) LOC7484626 (ppo) LOC7488152 (ppo) LOC7493560 (ppo) LOC9267894 (osa) LOC11423089 (mtr) LOC11424398 (mtr) LOC11425012 (mtr) LOC11430604 (mtr) LOC11434678 (mtr) LOC11440725 (mtr) LOC18095015 (ppo) LOC18095017 (ppo) LOC18105053 (ppo) LOC18108932 (ppo) LOC25494404 (mtr) LOC100037539 (tae) LOC100305883 (gma) LOC100306055 (gma) LOC100306510 (gma) LOC100499726 (gma) LOC100793733 (gma) LOC100814571 (gma) LOC100815185 (gma) LOC100817318 (gma) LOC100818917 (gma) LOC101245521 (sly) LOC101246456 (sly) LOC101255907 (sly) LOC101256205 (sly) LOC101257400 (sly) LOC101259287 (sly) LOC101264570 (sly) LOC101265188 (sly) LOC101265675 (sly) LOC101266080 (sly) LOC101266573 (sly) LOC101266879 (sly) LOC101267363 (sly) LOC103834489 (bra) LOC103837856 (bra) LOC103841086 (bra) LOC103851584 (bra) LOC103851585 (bra) LOC103856638 (bra) LOC103856656 (bra) LOC103857181 (bra) LOC103859330 (bra) LOC103860716 (bra) LOC103862232 (bra) LOC103865674 (bra) LOC103865675 (bra) LOC103867096 (bra) LOC103867097 (bra) LOC103870590 (bra) LOC103872277 (bra) LOC107275307 (osa) LOC107277115 (osa) LOC112324504 (ppo) LOC112328648 (ppo) LOC120575797 (mtr) LOC123042205 (tae) LOC123042207 (tae) LOC123054682 (tae) LOC123054683 (tae) LOC123057717 (tae) LOC123057718 (tae) LOC123064629 (tae) LOC123064630 (tae) LOC123064631 (tae) LOC123064632 (tae) LOC123064633 (tae) LOC123064634 (tae) LOC123068466 (tae) LOC123068467 (tae) LOC123068468 (tae) LOC123068469 (tae) LOC123068470 (tae) LOC123068471 (tae) LOC123068472 (tae) LOC123068474 (tae) LOC123068475 (tae) LOC123068476 (tae) LOC123068477 (tae) LOC123082095 (tae) LOC123094652 (tae) LOC123099738 (tae) LOC123103162 (tae) LOC123106873 (tae) LOC123120372 (tae) LOC123151888 (tae) LOC123162882 (tae) LOC123168877 (tae) LOC123172506 (tae) LOC123172507 (tae) LOC123172511 (tae) LOC123173684 (tae) LOC123173685 (tae) LOC123173686 (tae) LOC123174762 (tae) LOC123177390 (tae) LOC123177877 (tae) LOC123177917 (tae) LOC123178136 (tae) LOC123190531 (tae) LOC123190532 (tae) LOC123398303 (hvu) LOC123398807 (hvu) LOC123411030 (hvu) LOC123427941 (hvu) LOC123427943 (hvu) LOC123430897 (hvu) LOC123439289 (hvu) LOC123439290 (hvu) LOC123439291 (hvu) LOC123442595 (hvu) LOC123442596 (hvu) LOC123442597 (hvu) LOC123442598 (hvu) LOC123446223 (hvu) | ||||||||||||||||||||||||||||||||||||||||||||||||
| Subcellular localization wolf |
|
||||||||||||||||||||||||||||||||||||||||||||||||
| Subcellular localization TargetP |
|
||||||||||||||||||||||||||||||||||||||||||||||||
| Gene coexpression | |||||||||||||||||||||||||||||||||||||||||||||||||
| Network*for coexpressed genes |
|
||||||||||||||||||||||||||||||||||||||||||||||||
|---|---|---|---|---|---|---|---|---|---|---|---|---|---|---|---|---|---|---|---|---|---|---|---|---|---|---|---|---|---|---|---|---|---|---|---|---|---|---|---|---|---|---|---|---|---|---|---|---|---|
| Coexpressed gene list |
[Coexpressed gene list for LTP2] | ||||||||||||||||||||||||||||||||||||||||||||||||
| Gene expression | |||||||||||||||||||||||||||||||||||||||||||||||||
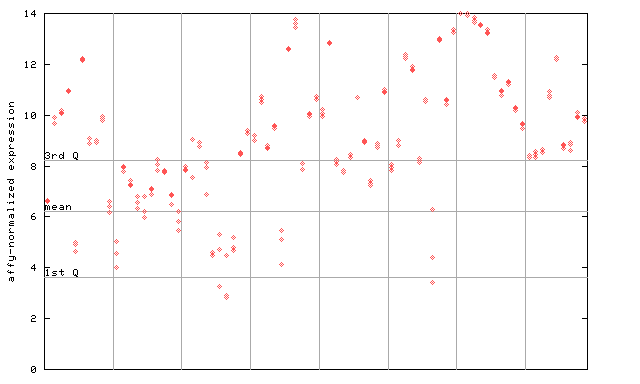
| All samples | [Expression pattern for all samples] | ||||||||||||||||||||||||||||||||||||||||||||||||
| AtGenExpress* (Development) |
266415_at

X axis is samples (pdf file), and Y axis is log2-expression. |
||||||||||||||||||||||||||||||||||||||||||||||||
| AtGenExpress* (Stress) |
266415_at

X axis is samples (pdf file), and Y axis is log2-expression. |
||||||||||||||||||||||||||||||||||||||||||||||||
| AtGenExpress* (Hormone) |
266415_at

X axis is samples (xls file), and Y axis is log-expression. |
||||||||||||||||||||||||||||||||||||||||||||||||
| Link to other DBs | ||
| Entrez Gene ID | 818435 |


|
| Refseq ID (protein) | NP_181387.1 |  |
The preparation time of this page was 0.1 [sec].


