[←][→] ath
| functional annotation | |||||||||||||||||||||||||||||||||||||||||||||||||||||||||
| Function | phosphorylethanolamine cytidylyltransferase 1 |


|
|||||||||||||||||||||||||||||||||||||||||||||||||||||||
| GO BP |
|
||||||||||||||||||||||||||||||||||||||||||||||||||||||||
| GO CC |
|
||||||||||||||||||||||||||||||||||||||||||||||||||||||||
| GO MF |
|
||||||||||||||||||||||||||||||||||||||||||||||||||||||||
| KEGG | ath00440 [list] [network] Phosphonate and phosphinate metabolism (5 genes) |  |
|||||||||||||||||||||||||||||||||||||||||||||||||||||||
| ath00564 [list] [network] Glycerophospholipid metabolism (99 genes) |  |
||||||||||||||||||||||||||||||||||||||||||||||||||||||||
| Protein | NP_181401.1 | ||||||||||||||||||||||||||||||||||||||||||||||||||||||||
| BLAST | NP_181401.1 | ||||||||||||||||||||||||||||||||||||||||||||||||||||||||
| Orthologous | [Ortholog page] LOC4349636 (osa) LOC11430081 (mtr) LOC18100047 (ppo) LOC100775240 (gma) LOC100804449 (gma) LOC101255745 (sly) LOC103857803 (bra) LOC103865679 (bra) LOC103867086 (bra) LOC123086429 (tae) LOC123091565 (tae) LOC123096520 (tae) LOC123103140 (tae) LOC123111337 (tae) LOC123120389 (tae) LOC123395982 (hvu) LOC123448111 (hvu) | ||||||||||||||||||||||||||||||||||||||||||||||||||||||||
| Subcellular localization wolf |
|
||||||||||||||||||||||||||||||||||||||||||||||||||||||||
| Subcellular localization TargetP |
|
||||||||||||||||||||||||||||||||||||||||||||||||||||||||
| Gene coexpression | |||||||||||||||||||||||||||||||||||||||||||||||||||||||||
| Network*for coexpressed genes |
|
||||||||||||||||||||||||||||||||||||||||||||||||||||||||
|---|---|---|---|---|---|---|---|---|---|---|---|---|---|---|---|---|---|---|---|---|---|---|---|---|---|---|---|---|---|---|---|---|---|---|---|---|---|---|---|---|---|---|---|---|---|---|---|---|---|---|---|---|---|---|---|---|---|
| Coexpressed gene list |
[Coexpressed gene list for PECT1] | ||||||||||||||||||||||||||||||||||||||||||||||||||||||||
| Gene expression | |||||||||||||||||||||||||||||||||||||||||||||||||||||||||
| All samples | [Expression pattern for all samples] | ||||||||||||||||||||||||||||||||||||||||||||||||||||||||
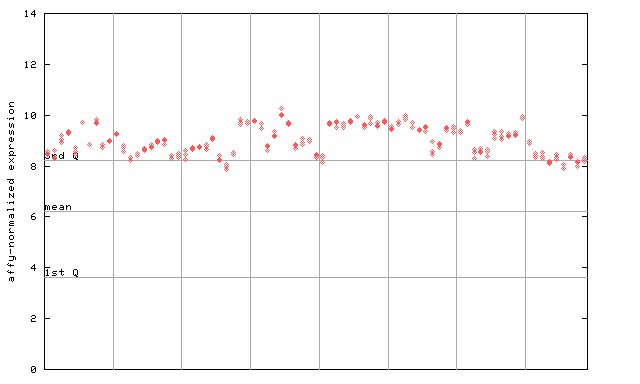
| AtGenExpress* (Development) |
266399_at

X axis is samples (pdf file), and Y axis is log2-expression. |
||||||||||||||||||||||||||||||||||||||||||||||||||||||||
| AtGenExpress* (Stress) |
266399_at

X axis is samples (pdf file), and Y axis is log2-expression. |
||||||||||||||||||||||||||||||||||||||||||||||||||||||||
| AtGenExpress* (Hormone) |
266399_at

X axis is samples (xls file), and Y axis is log-expression. |
||||||||||||||||||||||||||||||||||||||||||||||||||||||||
| Link to other DBs | ||
| Entrez Gene ID | 818449 |


|
| Refseq ID (protein) | NP_181401.1 |  |
The preparation time of this page was 0.1 [sec].


