| functional annotation |
| Function |
Pyridoxal phosphate (PLP)-dependent transferases superfamily protein |


|
| GO BP |
|
GO:0006105 [list] [network] succinate metabolic process
|
(1 genes)
|
IMP
|
 |
|
GO:0019484 [list] [network] beta-alanine catabolic process
|
(1 genes)
|
IMP
|
 |
|
GO:0006540 [list] [network] glutamate decarboxylation to succinate
|
(2 genes)
|
IMP
|
 |
|
GO:0009448 [list] [network] gamma-aminobutyric acid metabolic process
|
(2 genes)
|
IMP
|
 |
|
GO:0009450 [list] [network] gamma-aminobutyric acid catabolic process
|
(2 genes)
|
IMP
|
 |
|
GO:0009865 [list] [network] pollen tube adhesion
|
(2 genes)
|
IMP
|
 |
|
GO:0006020 [list] [network] inositol metabolic process
|
(7 genes)
|
IMP
|
 |
|
GO:0006541 [list] [network] glutamine metabolic process
|
(8 genes)
|
IMP
|
 |
|
GO:0006536 [list] [network] glutamate metabolic process
|
(17 genes)
|
IMP
|
 |
|
GO:0009943 [list] [network] adaxial/abaxial axis specification
|
(33 genes)
|
IMP
|
 |
|
GO:0005985 [list] [network] sucrose metabolic process
|
(40 genes)
|
IMP
|
 |
|
GO:0010183 [list] [network] pollen tube guidance
|
(49 genes)
|
IMP
|
 |
|
GO:0009860 [list] [network] pollen tube growth
|
(149 genes)
|
IMP
NAS
|
 |
|
GO:0048366 [list] [network] leaf development
|
(465 genes)
|
IMP
|
 |
|
GO:0009651 [list] [network] response to salt stress
|
(607 genes)
|
IMP
|
 |
|
GO:0048364 [list] [network] root development
|
(1192 genes)
|
IMP
|
 |
|
GO:0048367 [list] [network] shoot system development
|
(1318 genes)
|
IMP
|
 |
|
GO:0010154 [list] [network] fruit development
|
(1349 genes)
|
IMP
|
 |
|
GO:0010033 [list] [network] response to organic substance
|
(3399 genes)
|
IMP
|
 |
|
| GO CC |
|
| GO MF |
|
GO:0034387 [list] [network] 4-aminobutyrate:pyruvate transaminase activity
|
(1 genes)
|
IDA
|
 |
|
GO:0003867 [list] [network] 4-aminobutyrate transaminase activity
|
(2 genes)
|
IMP
NAS
|
 |
|
GO:0050897 [list] [network] cobalt ion binding
|
(44 genes)
|
HDA
|
 |
|
GO:0008270 [list] [network] zinc ion binding
|
(429 genes)
|
HDA
|
 |
|
| KEGG |
ath00250 [list] [network] Alanine, aspartate and glutamate metabolism (51 genes) |
 |
| ath00650 [list] [network] Butanoate metabolism (20 genes) |
 |
| Protein |
NP_001189947.1
NP_566700.1
|
| BLAST |
NP_001189947.1
NP_566700.1
|
| Orthologous |
[Ortholog page]
GABA-TP1 (sly)
GABA-TP2 (sly)
GABA-TP3 (sly)
LOC4328053 (osa)
LOC4336982 (osa)
LOC4336983 (osa)
LOC4344928 (osa)
LOC7455851 (ppo)
LOC7495636 (ppo)
LOC11438136 (mtr)
LOC100682496 (tae)
LOC100792355 (gma)
LOC100815181 (gma)
LOC101258391 (sly)
LOC103834779 (bra)
LOC103869111 (bra)
LOC123161053 (tae)
LOC123165077 (tae)
LOC123190180 (tae)
LOC123413507 (hvu)
LOC123427606 (hvu)
|
Subcellular
localization
wolf |
|
chlo 10
|
(predict for NP_001189947.1)
|
|
mito 6,
chlo_mito 5,
chlo 4,
cyto_mito 3
|
(predict for NP_566700.1)
|
|
Subcellular
localization
TargetP |
|
mito 3
|
(predict for NP_001189947.1)
|
|
mito 9
|
(predict for NP_566700.1)
|
|
| Gene coexpression |
Network*for
coexpressed
genes |
| KEGG* ID |
Title |
#genes |
Link to the KEGG* map
(Multiple genes) |
| ath00280 |
Valine, leucine and isoleucine degradation |
6 |
 |
| ath01200 |
Carbon metabolism |
6 |
 |
| ath00250 |
Alanine, aspartate and glutamate metabolism |
4 |
 |
| ath00071 |
Fatty acid degradation |
4 |
 |
| ath01212 |
Fatty acid metabolism |
4 |
 |
Genes directly connected with POP2 on the network
| coex z* |
Locus |
Function* |
CoexViewer |
Entrez Gene ID* |
| 7.7 |
ASP3 |
aspartate aminotransferase 3 |
[detail] |
831024 |
| 7.0 |
CSY2 |
citrate synthase 2 |
[detail] |
825044 |
| 6.9 |
ALDH6B2 |
aldehyde dehydrogenase 6B2 |
[detail] |
815903 |
| 6.5 |
ALDH12A1 |
aldehyde dehydrogenase 12A1 |
[detail] |
836373 |
|
Coexpressed
gene list |
[Coexpressed gene list for POP2]
|
| Gene expression |
| All samples |
[Expression pattern for all samples]
|
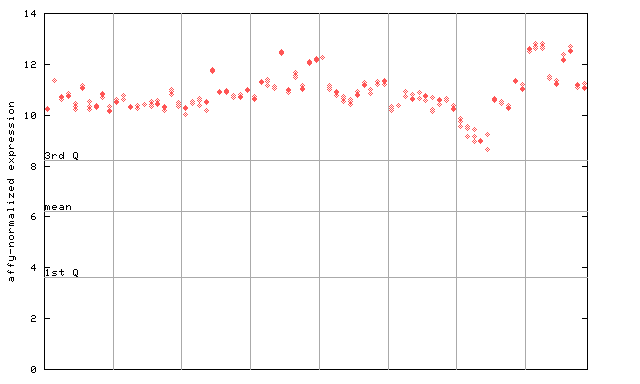
AtGenExpress*
(Development) |
256765_at

X axis is samples (pdf file), and Y axis is log2-expression.
"1st Q", "mean" and "3rd Q" indecate the values for all genes on a GeneChip. Q: quartile.
|
AtGenExpress*
(Stress) |
256765_at

X axis is samples (pdf file), and Y axis is log2-expression.
|
AtGenExpress*
(Hormone) |
256765_at

X axis is samples (xls file), and Y axis is log-expression.
|


