| functional annotation |
| Function |
Protein kinase superfamily protein |


|
| GO BP |
|
GO:0009812 [list] [network] flavonoid metabolic process
|
(131 genes)
|
IEA
|
 |
|
GO:0071482 [list] [network] cellular response to light stimulus
|
(146 genes)
|
IEA
|
 |
|
GO:0046148 [list] [network] pigment biosynthetic process
|
(155 genes)
|
IEA
|
 |
|
GO:0009637 [list] [network] response to blue light
|
(160 genes)
|
IEA
|
 |
|
GO:1901617 [list] [network] organic hydroxy compound biosynthetic process
|
(164 genes)
|
IEA
|
 |
|
GO:0006721 [list] [network] terpenoid metabolic process
|
(208 genes)
|
IEA
|
 |
|
GO:0009639 [list] [network] response to red or far red light
|
(365 genes)
|
IEA
|
 |
|
GO:0009642 [list] [network] response to light intensity
|
(373 genes)
|
IEA
|
 |
|
GO:0006468 [list] [network] protein phosphorylation
|
(639 genes)
|
IEA
|
 |
|
GO:0044283 [list] [network] small molecule biosynthetic process
|
(765 genes)
|
IEA
|
 |
|
GO:0006970 [list] [network] response to osmotic stress
|
(883 genes)
|
IEA
|
 |
|
GO:0009414 [list] [network] response to water deprivation
|
(1006 genes)
|
IEA
|
 |
|
| GO CC |
|
| GO MF |
|
| KEGG |
|
|
| Protein |
NP_566745.1
|
| BLAST |
NP_566745.1
|
| Orthologous |
[Ortholog page]
LOC4331141 (osa)
LOC7460517 (ppo)
LOC25483068 (mtr)
LOC100779687 (gma)
LOC100805603 (gma)
LOC101257407 (sly)
LOC103828682 (bra)
LOC103832022 (bra)
LOC123128972 (tae)
LOC123146142 (tae)
LOC123401504 (hvu)
|
Subcellular
localization
wolf |
|
cyto 3,
plas 3,
cyto_plas 3,
vacu 1,
E.R. 1,
golg_plas 1,
E.R._vacu 1,
cyto_pero 1,
cysk_plas 1,
mito_plas 1
|
(predict for NP_566745.1)
|
|
Subcellular
localization
TargetP |
|
chlo 9
|
(predict for NP_566745.1)
|
|
| Gene coexpression |
Network*for
coexpressed
genes |
| KEGG* ID |
Title |
#genes |
Link to the KEGG* map
(Multiple genes) |
| ath00900 |
Terpenoid backbone biosynthesis |
2 |
 |
Genes directly connected with AT3G24190 on the network
| coex z* |
Locus |
Function* |
CoexViewer |
Entrez Gene ID* |
| 10.7 |
FTSH1 |
FTSH protease 1 |
[detail] |
841447 |
| 10.2 |
FTSH8 |
FTSH protease 8 |
[detail] |
837154 |
| 10.0 |
AT3G56290 |
potassium transporter |
[detail] |
824796 |
| 8.6 |
FADA |
fatty acid desaturase A |
[detail] |
828811 |
| 7.5 |
CCD1 |
carotenoid cleavage dioxygenase 1 |
[detail] |
825527 |
| 7.5 |
CAT2 |
catalase 2 |
[detail] |
829661 |
| 7.5 |
AT1G76570 |
Chlorophyll A-B binding family protein |
[detail] |
843990 |
| 7.5 |
ACDO1 |
Protein kinase superfamily protein |
[detail] |
829266 |
| 7.0 |
KAC1 |
kinesin like protein for actin based chloroplast movement 1 |
[detail] |
830911 |
|
Coexpressed
gene list |
[Coexpressed gene list for AT3G24190]
|
| Gene expression |
| All samples |
[Expression pattern for all samples]
|
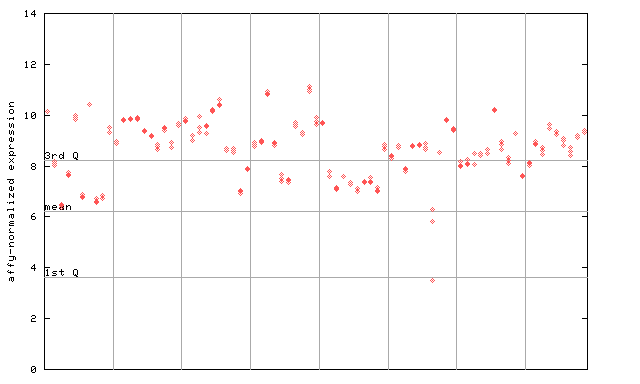
AtGenExpress*
(Development) |
257253_at

X axis is samples (pdf file), and Y axis is log2-expression.
"1st Q", "mean" and "3rd Q" indecate the values for all genes on a GeneChip. Q: quartile.
|
AtGenExpress*
(Stress) |
257253_at

X axis is samples (pdf file), and Y axis is log2-expression.
|
AtGenExpress*
(Hormone) |
257253_at

X axis is samples (xls file), and Y axis is log-expression.
|


