| functional annotation |
| Function |
BTB and TAZ domain protein 2 |


|
| GO BP |
|
GO:0051973 [list] [network] positive regulation of telomerase activity
|
(2 genes)
|
IGI
IPI
|
 |
|
GO:0010167 [list] [network] response to nitrate
|
(30 genes)
|
IEP
|
 |
|
GO:0010182 [list] [network] sugar mediated signaling pathway
|
(38 genes)
|
IMP
|
 |
|
GO:0042542 [list] [network] response to hydrogen peroxide
|
(62 genes)
|
IEP
|
 |
|
GO:0009734 [list] [network] auxin-activated signaling pathway
|
(65 genes)
|
IMP
|
 |
|
GO:0007623 [list] [network] circadian rhythm
|
(123 genes)
|
IEP
|
 |
|
GO:0009738 [list] [network] abscisic acid-activated signaling pathway
|
(159 genes)
|
IMP
|
 |
|
GO:0009553 [list] [network] embryo sac development
|
(163 genes)
|
IGI
|
 |
|
GO:0009743 [list] [network] response to carbohydrate
|
(183 genes)
|
IEP
|
 |
|
GO:0009555 [list] [network] pollen development
|
(376 genes)
|
IGI
|
 |
|
GO:0009733 [list] [network] response to auxin
|
(384 genes)
|
IEP
|
 |
|
GO:0016567 [list] [network] protein ubiquitination
|
(434 genes)
|
IEA
|
 |
|
GO:0009751 [list] [network] response to salicylic acid
|
(438 genes)
|
IEP
|
 |
|
GO:0009409 [list] [network] response to cold
|
(472 genes)
|
IEP
|
 |
|
GO:0009651 [list] [network] response to salt stress
|
(607 genes)
|
IEP
|
 |
|
GO:0009753 [list] [network] response to jasmonic acid
|
(611 genes)
|
IEP
|
 |
|
GO:0009611 [list] [network] response to wounding
|
(816 genes)
|
IEP
|
 |
|
GO:0009737 [list] [network] response to abscisic acid
|
(1086 genes)
|
IEP
|
 |
|
GO:0006355 [list] [network] regulation of DNA-templated transcription
|
(1656 genes)
|
TAS
|
 |
|
| GO CC |
|
| GO MF |
|
GO:0005516 [list] [network] calmodulin binding
|
(128 genes)
|
IDA
|
 |
|
GO:0003700 [list] [network] DNA-binding transcription factor activity
|
(1576 genes)
|
IMP
|
 |
|
GO:0005515 [list] [network] protein binding
|
(5066 genes)
|
IPI
|
 |
|
| KEGG |
|
|
| Protein |
NP_001326126.1
NP_001326127.1
NP_566902.1
|
| BLAST |
NP_001326126.1
NP_001326127.1
NP_566902.1
|
| Orthologous |
[Ortholog page]
BT1 (ath)
LOC4324985 (osa)
LOC7453816 (ppo)
LOC11408709 (mtr)
LOC18103799 (ppo)
LOC18109700 (ppo)
LOC100785655 (gma)
LOC100807120 (gma)
LOC100813611 (gma)
LOC101253881 (sly)
LOC101263123 (sly)
LOC101263715 (sly)
LOC102665230 (gma)
LOC103855033 (bra)
LOC103873153 (bra)
LOC103873737 (bra)
LOC120579604 (mtr)
LOC123062984 (tae)
LOC123062985 (tae)
LOC123071865 (tae)
LOC123071866 (tae)
LOC123080180 (tae)
LOC123080181 (tae)
LOC123445147 (hvu)
LOC123445148 (hvu)
|
Subcellular
localization
wolf |
|
chlo 8,
nucl 1,
mito 1,
extr 1
|
(predict for NP_001326126.1)
|
|
nucl 4,
cyto 2,
cysk 2,
nucl_plas 2
|
(predict for NP_001326127.1)
|
|
nucl 6,
cyto 1,
chlo 1,
plas 1,
cysk 1,
golg 1,
golg_plas 1,
cyto_pero 1,
cysk_plas 1,
cyto_E.R. 1
|
(predict for NP_566902.1)
|
|
Subcellular
localization
TargetP |
|
mito 4
|
(predict for NP_001326126.1)
|
|
other 7
|
(predict for NP_001326127.1)
|
|
other 7
|
(predict for NP_566902.1)
|
|
| Gene coexpression |
Network*for
coexpressed
genes |
Genes directly connected with BT2 on the network
| coex z* |
Locus |
Function* |
CoexViewer |
Entrez Gene ID* |
| 9.6 |
AT1G49500 |
transcription initiation factor TFIID subunit 1b-like protein |
[detail] |
841374 |
| 8.4 |
AT5G21940 |
hybrid signal transduction histidine kinase M-like protein |
[detail] |
832254 |
| 8.4 |
BT5 |
BTB and TAZ domain protein 5 |
[detail] |
829915 |
| 8.2 |
CIPK3 |
CBL-interacting protein kinase 3 |
[detail] |
817240 |
| 7.9 |
BT1 |
BTB and TAZ domain protein 1 |
[detail] |
836437 |
| 6.7 |
RVE2 |
Homeodomain-like superfamily protein |
[detail] |
833700 |
| 6.4 |
AT5G14120 |
Major facilitator superfamily protein |
[detail] |
831262 |
| 5.3 |
AT1G61740 |
Sulfite exporter TauE/SafE family protein |
[detail] |
842471 |
| 5.1 |
AT5G65660 |
hydroxyproline-rich glycoprotein family protein |
[detail] |
836692 |
|
Coexpressed
gene list |
[Coexpressed gene list for BT2]
|
| Gene expression |
| All samples |
[Expression pattern for all samples]
|
AtGenExpress*
(Development) |
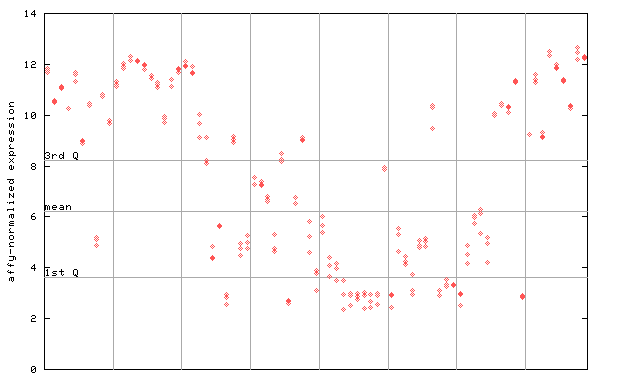
252367_at

X axis is samples (pdf file), and Y axis is log2-expression.
"1st Q", "mean" and "3rd Q" indecate the values for all genes on a GeneChip. Q: quartile.
|
AtGenExpress*
(Stress) |
252367_at

X axis is samples (pdf file), and Y axis is log2-expression.
|
AtGenExpress*
(Hormone) |
252367_at

X axis is samples (xls file), and Y axis is log-expression.
|


