[←][→] ath
| functional annotation | |||||||||||||||||||||||||||||||||||||||||||||||||||||||
| Function | O-acetylserine (thiol) lyase isoform C |


|
|||||||||||||||||||||||||||||||||||||||||||||||||||||
| GO BP |
|
||||||||||||||||||||||||||||||||||||||||||||||||||||||
| GO CC |
|
||||||||||||||||||||||||||||||||||||||||||||||||||||||
| GO MF |
|
||||||||||||||||||||||||||||||||||||||||||||||||||||||
| KEGG | ath00270 [list] [network] Cysteine and methionine metabolism (124 genes) |  |
|||||||||||||||||||||||||||||||||||||||||||||||||||||
| ath00920 [list] [network] Sulfur metabolism (42 genes) |  |
||||||||||||||||||||||||||||||||||||||||||||||||||||||
| ath01200 [list] [network] Carbon metabolism (273 genes) |  |
||||||||||||||||||||||||||||||||||||||||||||||||||||||
| ath01230 [list] [network] Biosynthesis of amino acids (244 genes) |  |
||||||||||||||||||||||||||||||||||||||||||||||||||||||
| Protein | NP_191535.2 NP_851022.1 NP_851023.1 | ||||||||||||||||||||||||||||||||||||||||||||||||||||||
| BLAST | NP_191535.2 NP_851022.1 NP_851023.1 | ||||||||||||||||||||||||||||||||||||||||||||||||||||||
| Orthologous | [Ortholog page] LOC543181 (tae) LOC547631 (gma) OASB (ath) CYSD1 (ath) OASA2 (ath) OASA1 (ath) CYSD2 (ath) DES1 (ath) LOC4327819 (osa) LOC4334101 (osa) LOC4352839 (osa) LOC7473407 (ppo) LOC11410728 (mtr) LOC11410729 (mtr) LOC11441090 (mtr) LOC11443458 (mtr) LOC11445174 (mtr) LOC11445175 (mtr) LOC18098918 (ppo) LOC18098921 (ppo) LOC18098924 (ppo) LOC18098926 (ppo) LOC18104598 (ppo) LOC18110974 (ppo) LOC18110977 (ppo) LOC25484655 (mtr) LOC25485205 (mtr) OAS-TL1 (gma) OAS-TL2 (gma) OAS-TL6 (gma) OAS-TL4 (gma) OAS-TL7 (gma) LOC100775420 (gma) LOC100794958 (gma) LOC100815330 (gma) LOC100818242 (gma) LOC101244415 (sly) LOC101246283 (sly) LOC101246567 (sly) LOC101254617 (sly) OASA4 (bra) LOC103837317 (bra) LOC103854642 (bra) LOC103859070 (bra) LOC103862931 (bra) LOC103866104 (bra) LOC103866743 (bra) LOC103871539 (bra) LOC112323242 (ppo) LOC112323252 (ppo) LOC123041396 (tae) LOC123049383 (tae) LOC123060240 (tae) LOC123068744 (tae) LOC123077247 (tae) LOC123430277 (hvu) LOC123442777 (hvu) LOC123452200 (hvu) | ||||||||||||||||||||||||||||||||||||||||||||||||||||||
| Subcellular localization wolf |
|
||||||||||||||||||||||||||||||||||||||||||||||||||||||
| Subcellular localization TargetP |
|
||||||||||||||||||||||||||||||||||||||||||||||||||||||
| Gene coexpression | |||||||||||||||||||||||||||||||||||||||||||||||||||||||
| Network*for coexpressed genes |
|
||||||||||||||||||||||||||||||||||||||||||||||||||||||
|---|---|---|---|---|---|---|---|---|---|---|---|---|---|---|---|---|---|---|---|---|---|---|---|---|---|---|---|---|---|---|---|---|---|---|---|---|---|---|---|---|---|---|---|---|---|---|---|---|---|---|---|---|---|---|---|
| Coexpressed gene list |
[Coexpressed gene list for OASC] | ||||||||||||||||||||||||||||||||||||||||||||||||||||||
| Gene expression | |||||||||||||||||||||||||||||||||||||||||||||||||||||||
| All samples | [Expression pattern for all samples] | ||||||||||||||||||||||||||||||||||||||||||||||||||||||
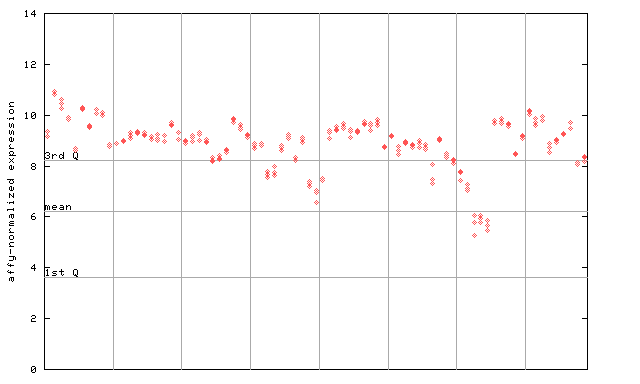
| AtGenExpress* (Development) |
251487_at

X axis is samples (pdf file), and Y axis is log2-expression. |
||||||||||||||||||||||||||||||||||||||||||||||||||||||
| AtGenExpress* (Stress) |
251487_at

X axis is samples (pdf file), and Y axis is log2-expression. |
||||||||||||||||||||||||||||||||||||||||||||||||||||||
| AtGenExpress* (Hormone) |
251487_at

X axis is samples (xls file), and Y axis is log-expression. |
||||||||||||||||||||||||||||||||||||||||||||||||||||||
| Link to other DBs | ||
| Entrez Gene ID | 825145 |


|
| Refseq ID (protein) | NP_191535.2 |  |
| NP_851022.1 |  |
|
| NP_851023.1 |  |
|
The preparation time of this page was 0.1 [sec].


