[←][→] ath
| functional annotation | ||||||||||||||||||||||||||||||||||||
| Function | PATATIN-like protein 9 |


|
||||||||||||||||||||||||||||||||||
| GO BP |
|
|||||||||||||||||||||||||||||||||||
| GO CC |
|
|||||||||||||||||||||||||||||||||||
| GO MF |
|
|||||||||||||||||||||||||||||||||||
| KEGG | ||||||||||||||||||||||||||||||||||||
| Protein | NP_567142.1 | |||||||||||||||||||||||||||||||||||
| BLAST | NP_567142.1 | |||||||||||||||||||||||||||||||||||
| Orthologous | [Ortholog page] LOC7464678 (ppo) LOC7480040 (ppo) LOC11425062 (mtr) LOC100777557 (gma) LOC100795441 (gma) LOC101257105 (sly) LOC103842122 (bra) LOC103862753 (bra) | |||||||||||||||||||||||||||||||||||
| Subcellular localization wolf |
|
|||||||||||||||||||||||||||||||||||
| Subcellular localization TargetP |
|
|||||||||||||||||||||||||||||||||||
| Gene coexpression | ||||||||||||||||||||||||||||||||||||
| Network*for coexpressed genes |
|
|||||||||||||||||||||||||||||||||||
|---|---|---|---|---|---|---|---|---|---|---|---|---|---|---|---|---|---|---|---|---|---|---|---|---|---|---|---|---|---|---|---|---|---|---|---|---|
| Coexpressed gene list |
[Coexpressed gene list for PLP9] | |||||||||||||||||||||||||||||||||||
| Gene expression | ||||||||||||||||||||||||||||||||||||
| All samples | [Expression pattern for all samples] | |||||||||||||||||||||||||||||||||||
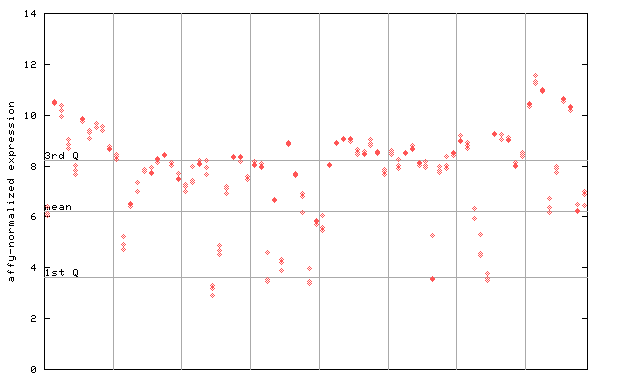
| AtGenExpress* (Development) |
251174_at

X axis is samples (pdf file), and Y axis is log2-expression. |
|||||||||||||||||||||||||||||||||||
| AtGenExpress* (Stress) |
251174_at

X axis is samples (pdf file), and Y axis is log2-expression. |
|||||||||||||||||||||||||||||||||||
| AtGenExpress* (Hormone) |
251174_at

X axis is samples (xls file), and Y axis is log-expression. |
|||||||||||||||||||||||||||||||||||
| Link to other DBs | ||
| Entrez Gene ID | 825495 |


|
| Refseq ID (protein) | NP_567142.1 |  |
The preparation time of this page was 0.1 [sec].

