| functional annotation |
| Function |
photosynthetic electron transfer C |


|
| GO BP |
|
GO:0010196 [list] [network] nonphotochemical quenching
|
(16 genes)
|
IMP
|
 |
|
GO:0009767 [list] [network] photosynthetic electron transport chain
|
(39 genes)
|
TAS
|
 |
|
| GO CC |
|
| GO MF |
|
GO:0046028 [list] [network] electron transporter, transferring electrons from cytochrome b6/f complex of photosystem II activity
|
(2 genes)
|
TAS
|
 |
|
GO:0003729 [list] [network] mRNA binding
|
(1535 genes)
|
IDA
|
 |
|
GO:0005515 [list] [network] protein binding
|
(5066 genes)
|
IPI
|
 |
|
| KEGG |
ath00195 [list] [network] Photosynthesis (77 genes) |
 |
| Protein |
NP_192237.1
NP_849295.1
|
| BLAST |
NP_192237.1
NP_849295.1
|
| Orthologous |
[Ortholog page]
petC (tae)
LOC4343570 (osa)
LOC7494443 (ppo)
LOC7498162 (ppo)
LOC11427739 (mtr)
PETC (gma)
LOC100799420 (gma)
LOC101243864 (sly)
LOC103846718 (bra)
LOC103858708 (bra)
LOC123044564 (tae)
LOC123188289 (tae)
LOC123425725 (hvu)
|
Subcellular
localization
wolf |
|
chlo 9
|
(predict for NP_192237.1)
|
|
chlo 6,
cyto 2,
mito 1,
cyto_plas 1
|
(predict for NP_849295.1)
|
|
Subcellular
localization
TargetP |
|
chlo 6
|
(predict for NP_192237.1)
|
|
chlo 4
|
(predict for NP_849295.1)
|
|
| Gene coexpression |
Network*for
coexpressed
genes |
| KEGG* ID |
Title |
#genes |
Link to the KEGG* map
(Multiple genes) |
| ath00195 |
Photosynthesis |
9 |
 |
| ath01200 |
Carbon metabolism |
4 |
 |
| ath00710 |
Carbon fixation in photosynthetic organisms |
3 |
 |
| ath01230 |
Biosynthesis of amino acids |
2 |
 |
| ath00190 |
Oxidative phosphorylation |
2 |
 |
Genes directly connected with PETC on the network
| coex z* |
Locus |
Function* |
CoexViewer |
Entrez Gene ID* |
| 14.8 |
DRT112 |
Cupredoxin superfamily protein |
[detail] |
838622 |
| 14.0 |
GAPA |
glyceraldehyde 3-phosphate dehydrogenase A subunit |
[detail] |
822277 |
| 14.0 |
AT2G26500 |
cytochrome b6f complex subunit (petM) |
[detail] |
817191 |
| 13.9 |
FNR1 |
ferredoxin-NADP[+]-oxidoreductase 1 |
[detail] |
836751 |
| 13.7 |
ATPC1 |
ATPase, F1 complex, gamma subunit protein |
[detail] |
825797 |
| 12.6 |
RCA |
rubisco activase |
[detail] |
818558 |
| 11.8 |
PDE334 |
ATPase, F0 complex, subunit B/B', bacterial/chloroplast |
[detail] |
829359 |
| 10.3 |
SHM1 |
serine transhydroxymethyltransferase 1 |
[detail] |
829949 |
| 9.4 |
AT3G61870 |
plant/protein |
[detail] |
825360 |
| 9.3 |
AT1G71500 |
Rieske (2Fe-2S) domain-containing protein |
[detail] |
843491 |
| 9.2 |
HCF136 |
photosystem II stability/assembly factor, chloroplast (HCF136) |
[detail] |
832376 |
| 9.0 |
RPE |
D-ribulose-5-phosphate-3-epimerase |
[detail] |
836262 |
| 7.0 |
THI1 |
thiazole biosynthetic enzyme, chloroplast (ARA6) (THI1) (THI4) |
[detail] |
835567 |
| 6.8 |
AT3G26070 |
Plastid-lipid associated protein PAP / fibrillin family protein |
[detail] |
822204 |
|
Coexpressed
gene list |
[Coexpressed gene list for PETC]
|
| Gene expression |
| All samples |
[Expression pattern for all samples]
|
AtGenExpress*
(Development) |
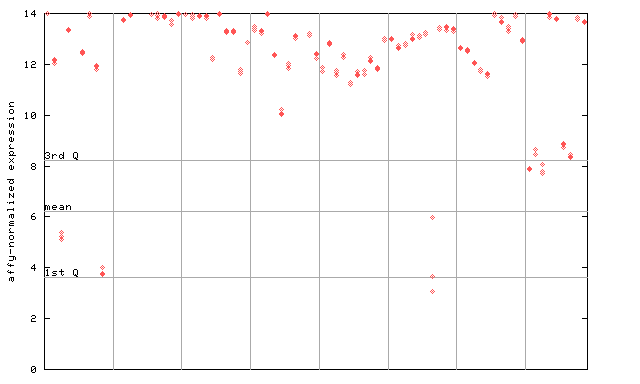
255435_at

X axis is samples (pdf file), and Y axis is log2-expression.
"1st Q", "mean" and "3rd Q" indecate the values for all genes on a GeneChip. Q: quartile.
|
AtGenExpress*
(Stress) |
255435_at

X axis is samples (pdf file), and Y axis is log2-expression.
|
AtGenExpress*
(Hormone) |
255435_at

X axis is samples (xls file), and Y axis is log-expression.
|


