| functional annotation |
| Function |
Tyrosine transaminase family protein |


|
| GO BP |
|
GO:0010188 [list] [network] response to microbial phytotoxin
|
(6 genes)
|
IEP
|
 |
|
GO:0042538 [list] [network] hyperosmotic salinity response
|
(58 genes)
|
TAS
|
 |
|
GO:0006520 [list] [network] amino acid metabolic process
|
(418 genes)
|
IEA
IEP
|
 |
|
GO:0009753 [list] [network] response to jasmonic acid
|
(611 genes)
|
IEP
|
 |
|
GO:0009611 [list] [network] response to wounding
|
(816 genes)
|
IEP
|
 |
|
GO:0009737 [list] [network] response to abscisic acid
|
(1086 genes)
|
IEP
|
 |
|
GO:0009058 [list] [network] biosynthetic process
|
(3135 genes)
|
IEA
|
 |
|
| GO CC |
|
| GO MF |
|
GO:0004121 [list] [network] cystathionine beta-lyase activity
|
(2 genes)
|
IDA
|
 |
|
GO:0050362 [list] [network] L-tryptophan:2-oxoglutarate aminotransferase activity
|
(4 genes)
|
IDA
|
 |
|
GO:0004021 [list] [network] L-alanine:2-oxoglutarate aminotransferase activity
|
(5 genes)
|
IDA
|
 |
|
GO:0004838 [list] [network] L-tyrosine:2-oxoglutarate aminotransferase activity
|
(5 genes)
|
IDA
|
 |
|
GO:0004069 [list] [network] L-aspartate:2-oxoglutarate aminotransferase activity
|
(9 genes)
|
IDA
|
 |
|
GO:0030170 [list] [network] pyridoxal phosphate binding
|
(26 genes)
|
IEA
|
 |
|
GO:0008483 [list] [network] transaminase activity
|
(44 genes)
|
IEA
NAS
|
 |
|
| KEGG |
ath00270 [list] [network] Cysteine and methionine metabolism (124 genes) |
 |
| Protein |
NP_001031705.2
NP_194091.1
NP_849430.1
|
| BLAST |
NP_001031705.2
NP_194091.1
NP_849430.1
|
| Orthologous |
[Ortholog page]
AT4G23590 (ath)
LOC103861272 (bra)
|
Subcellular
localization
wolf |
|
cyto 8,
chlo 2
|
(predict for NP_001031705.2)
|
|
cyto 7,
chlo 3
|
(predict for NP_194091.1)
|
|
cyto 6,
cyto_E.R. 4,
nucl 1,
chlo 1,
golg 1,
cysk_nucl 1,
nucl_plas 1
|
(predict for NP_849430.1)
|
|
Subcellular
localization
TargetP |
|
other 5
|
(predict for NP_001031705.2)
|
|
other 5
|
(predict for NP_194091.1)
|
|
scret 4,
other 3
|
(predict for NP_849430.1)
|
|
| Gene coexpression |
Network*for
coexpressed
genes |
| KEGG* ID |
Title |
#genes |
Link to the KEGG* map
(Multiple genes) |
| ath01200 |
Carbon metabolism |
2 |
 |
| ath00592 |
alpha-Linolenic acid metabolism |
2 |
 |
Genes directly connected with CORI3 on the network
| coex z* |
Locus |
Function* |
CoexViewer |
Entrez Gene ID* |
| 14.7 |
LOX2 |
lipoxygenase 2 |
[detail] |
823650 |
| 7.5 |
AT3G28220 |
TRAF-like family protein |
[detail] |
822448 |
| 7.3 |
AT5G02940 |
ion channel POLLUX-like protein, putative (DUF1012) |
[detail] |
831426 |
| 6.8 |
ARGAH2 |
Arginase/deacetylase superfamily protein |
[detail] |
826458 |
| 6.3 |
ESP |
epithiospecifier protein |
[detail] |
841842 |
| 4.6 |
AT5G43745 |
ion channel POLLUX-like protein, putative (DUF1012) |
[detail] |
834395 |
| 4.5 |
FUM2 |
FUMARASE 2 |
[detail] |
835168 |
| 4.4 |
ELI3-1 |
cinnamyl alcohol dehydrogenase 7 |
[detail] |
829954 |
|
Coexpressed
gene list |
[Coexpressed gene list for CORI3]
|
| Gene expression |
| All samples |
[Expression pattern for all samples]
|
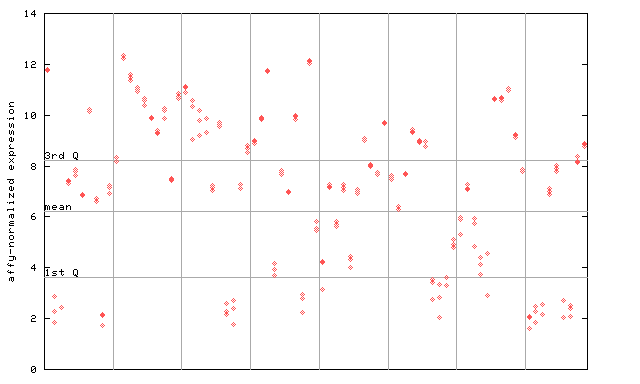
AtGenExpress*
(Development) |
254232_at

X axis is samples (pdf file), and Y axis is log2-expression.
"1st Q", "mean" and "3rd Q" indecate the values for all genes on a GeneChip. Q: quartile.
|
AtGenExpress*
(Stress) |
254232_at

X axis is samples (pdf file), and Y axis is log2-expression.
|
AtGenExpress*
(Hormone) |
254232_at

X axis is samples (xls file), and Y axis is log-expression.
|


