| functional annotation |
| Function |
Low temperature and salt responsive protein family |


|
| GO BP |
|
GO:0006568 [list] [network] tryptophan metabolic process
|
(46 genes)
|
IEA
|
 |
|
GO:0042430 [list] [network] indole-containing compound metabolic process
|
(170 genes)
|
IEA
|
 |
|
GO:0005976 [list] [network] polysaccharide metabolic process
|
(417 genes)
|
IEA
|
 |
|
GO:0046394 [list] [network] carboxylic acid biosynthetic process
|
(517 genes)
|
IEA
|
 |
|
GO:0009057 [list] [network] macromolecule catabolic process
|
(548 genes)
|
IEA
|
 |
|
GO:0010243 [list] [network] response to organonitrogen compound
|
(591 genes)
|
IEA
|
 |
|
GO:0031347 [list] [network] regulation of defense response
|
(749 genes)
|
IEA
|
 |
|
GO:0006970 [list] [network] response to osmotic stress
|
(883 genes)
|
IEA
|
 |
|
GO:0071554 [list] [network] cell wall organization or biogenesis
|
(898 genes)
|
IEA
|
 |
|
GO:0009414 [list] [network] response to water deprivation
|
(1006 genes)
|
IEA
|
 |
|
GO:0009737 [list] [network] response to abscisic acid
|
(1086 genes)
|
IEA
|
 |
|
GO:0044248 [list] [network] cellular catabolic process
|
(1086 genes)
|
IEA
|
 |
|
GO:0006629 [list] [network] lipid metabolic process
|
(1087 genes)
|
IEA
|
 |
|
GO:1901575 [list] [network] organic substance catabolic process
|
(1156 genes)
|
IEA
|
 |
|
GO:0019752 [list] [network] carboxylic acid metabolic process
|
(1307 genes)
|
IEA
|
 |
|
GO:0043412 [list] [network] macromolecule modification
|
(1856 genes)
|
IEA
|
 |
|
GO:0009416 [list] [network] response to light stimulus
|
(1981 genes)
|
IEA
|
 |
|
GO:0098542 [list] [network] defense response to other organism
|
(2060 genes)
|
IEA
|
 |
|
| GO CC |
|
| GO MF |
|
| KEGG |
|
|
| Protein |
NP_001154278.1
NP_194795.1
|
| BLAST |
NP_001154278.1
NP_194795.1
|
| Orthologous |
[Ortholog page]
LOC543081 (tae)
AT2G24040 (ath)
AT4G30650 (ath)
AT4G28088 (ath)
LOC4340332 (osa)
LOC4347832 (osa)
LOC7485253 (ppo)
LOC11437571 (mtr)
LOC18107787 (ppo)
LOC25494284 (mtr)
LOC100306426 (gma)
LOC101246835 (sly)
LOC101247136 (sly)
LOC103832337 (bra)
LOC103852521 (bra)
LOC103852533 (bra)
LOC103861992 (bra)
LOC103864512 (bra)
LOC103867853 (bra)
LOC123107704 (tae)
LOC123113084 (tae)
LOC123116854 (tae)
LOC123122602 (tae)
LOC123125437 (tae)
LOC123154926 (tae)
LOC123160243 (tae)
LOC123407491 (hvu)
LOC123451962 (hvu)
|
Subcellular
localization
wolf |
|
extr 4,
cyto 3,
plas 1,
vacu 1,
E.R. 1,
cysk 1,
golg 1,
golg_plas 1,
E.R._vacu 1,
cysk_plas 1,
E.R._plas 1
|
(predict for NP_001154278.1)
|
|
extr 4,
cyto 3,
plas 1,
vacu 1,
E.R. 1,
cysk 1,
golg 1,
golg_plas 1,
E.R._vacu 1,
cysk_plas 1,
E.R._plas 1
|
(predict for NP_194795.1)
|
|
Subcellular
localization
TargetP |
|
scret 9,
other 3
|
(predict for NP_001154278.1)
|
|
scret 9,
other 3
|
(predict for NP_194795.1)
|
|
| Gene coexpression |
Network*for
coexpressed
genes |
Genes directly connected with AT4G30660 on the network
| coex z* |
Locus |
Function* |
CoexViewer |
Entrez Gene ID* |
| 10.6 |
AT4G30650 |
Low temperature and salt responsive protein family |
[detail] |
829188 |
| 5.8 |
AT1G12845 |
uncharacterized protein |
[detail] |
837841 |
| 5.6 |
PLA2-ALPHA |
Phospholipase A2 family protein |
[detail] |
815261 |
| 5.4 |
WLIM2a |
GATA type zinc finger transcription factor family protein |
[detail] |
818577 |
|
Coexpressed
gene list |
[Coexpressed gene list for AT4G30660]
|
| Gene expression |
| All samples |
[Expression pattern for all samples]
|
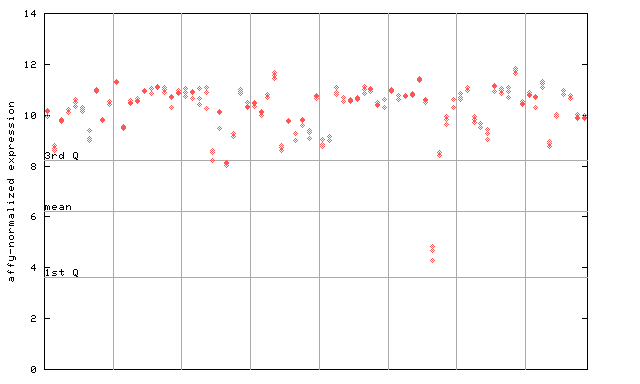
AtGenExpress*
(Development) |
253581_at

X axis is samples (pdf file), and Y axis is log2-expression.
"1st Q", "mean" and "3rd Q" indecate the values for all genes on a GeneChip. Q: quartile.
|
AtGenExpress*
(Stress) |
253581_at

X axis is samples (pdf file), and Y axis is log2-expression.
|
AtGenExpress*
(Hormone) |
253581_at

X axis is samples (xls file), and Y axis is log-expression.
|


