[←][→] ath
| functional annotation | ||||||||||||||||||||||||||||||||||||||||||||||||||||||||||||||||||||||
| Function | cytochrome P450, family 79, subfamily B, polypeptide 2 |


|
||||||||||||||||||||||||||||||||||||||||||||||||||||||||||||||||||||
| GO BP |
|
|||||||||||||||||||||||||||||||||||||||||||||||||||||||||||||||||||||
| GO CC |
|
|||||||||||||||||||||||||||||||||||||||||||||||||||||||||||||||||||||
| GO MF |
|
|||||||||||||||||||||||||||||||||||||||||||||||||||||||||||||||||||||
| KEGG | ath00380 [list] [network] Tryptophan metabolism (64 genes) |  |
||||||||||||||||||||||||||||||||||||||||||||||||||||||||||||||||||||
| ath00966 [list] [network] Glucosinolate biosynthesis (26 genes) |  |
|||||||||||||||||||||||||||||||||||||||||||||||||||||||||||||||||||||
| ath01210 [list] [network] 2-Oxocarboxylic acid metabolism (74 genes) |  |
|||||||||||||||||||||||||||||||||||||||||||||||||||||||||||||||||||||
| Protein | NP_001328605.1 NP_195705.1 | |||||||||||||||||||||||||||||||||||||||||||||||||||||||||||||||||||||
| BLAST | NP_001328605.1 NP_195705.1 | |||||||||||||||||||||||||||||||||||||||||||||||||||||||||||||||||||||
| Orthologous | [Ortholog page] CYP79B3 (ath) CYP79A2 (ath) CYP79A3P (ath) LOC4333284 (osa) LOC4335062 (osa) LOC4335063 (osa) LOC7465176 (ppo) LOC7470220 (ppo) LOC11444848 (mtr) LOC11444849 (mtr) LOC18104689 (ppo) LOC18109148 (ppo) LOC25490967 (mtr) LOC25491083 (mtr) LOC25491085 (mtr) LOC25491088 (mtr) LOC100779934 (gma) LOC100785254 (gma) LOC100786887 (gma) LOC100787378 (gma) LOC100809902 (gma) LOC101243884 (sly) LOC101244179 (sly) LOC101253063 (sly) LOC101257394 (sly) LOC101257953 (sly) LOC103835554 (bra) LOC103846879 (bra) LOC103850577 (bra) LOC103853878 (bra) LOC103862605 (bra) LOC103864341 (bra) LOC123038752 (tae) LOC123039366 (tae) LOC123039993 (tae) LOC123039994 (tae) LOC123040014 (tae) LOC123040956 (tae) LOC123048233 (tae) LOC123048234 (tae) LOC123048979 (tae) LOC123055460 (tae) LOC123058645 (tae) LOC123074835 (tae) LOC123082655 (tae) LOC123089799 (tae) LOC123100768 (tae) LOC123107274 (tae) LOC123115314 (tae) LOC123115317 (tae) LOC123116432 (tae) LOC123121204 (tae) LOC123125032 (tae) LOC123126171 (tae) LOC123129465 (tae) LOC123129689 (tae) LOC123133566 (tae) LOC123133567 (tae) LOC123133663 (tae) LOC123138575 (tae) LOC123141446 (tae) LOC123153217 (tae) LOC123153556 (tae) LOC123153558 (tae) LOC123158178 (tae) LOC123167847 (tae) LOC123171291 (tae) LOC123176610 (tae) LOC123176612 (tae) LOC123177158 (tae) LOC123177320 (tae) LOC123177321 (tae) LOC123184172 (tae) LOC123184233 (tae) LOC123184261 (tae) LOC123184264 (tae) LOC123184966 (tae) LOC123397570 (hvu) LOC123404908 (hvu) LOC123408008 (hvu) LOC123415757 (hvu) LOC123419823 (hvu) LOC123419826 (hvu) LOC123419827 (hvu) LOC123429100 (hvu) LOC123429103 (hvu) LOC123429104 (hvu) LOC123429105 (hvu) LOC123429106 (hvu) LOC123429663 (hvu) LOC123429809 (hvu) LOC123451228 (hvu) | |||||||||||||||||||||||||||||||||||||||||||||||||||||||||||||||||||||
| Subcellular localization wolf |
|
|||||||||||||||||||||||||||||||||||||||||||||||||||||||||||||||||||||
| Subcellular localization TargetP |
|
|||||||||||||||||||||||||||||||||||||||||||||||||||||||||||||||||||||
| Gene coexpression | ||||||||||||||||||||||||||||||||||||||||||||||||||||||||||||||||||||||
| Network*for coexpressed genes |
|
|||||||||||||||||||||||||||||||||||||||||||||||||||||||||||||||||||||
|---|---|---|---|---|---|---|---|---|---|---|---|---|---|---|---|---|---|---|---|---|---|---|---|---|---|---|---|---|---|---|---|---|---|---|---|---|---|---|---|---|---|---|---|---|---|---|---|---|---|---|---|---|---|---|---|---|---|---|---|---|---|---|---|---|---|---|---|---|---|---|
| Coexpressed gene list |
[Coexpressed gene list for CYP79B2] | |||||||||||||||||||||||||||||||||||||||||||||||||||||||||||||||||||||
| Gene expression | ||||||||||||||||||||||||||||||||||||||||||||||||||||||||||||||||||||||
| All samples | [Expression pattern for all samples] | |||||||||||||||||||||||||||||||||||||||||||||||||||||||||||||||||||||
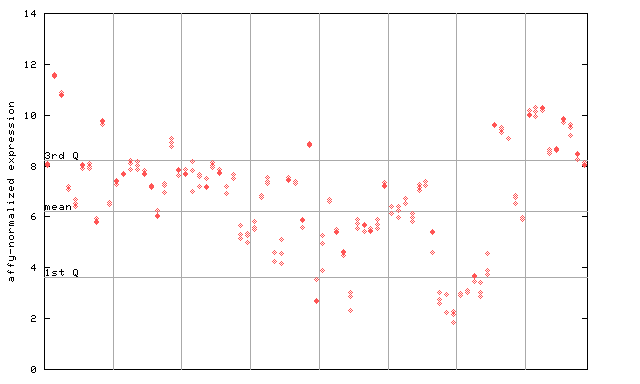
| AtGenExpress* (Development) |
252827_at

X axis is samples (pdf file), and Y axis is log2-expression. |
|||||||||||||||||||||||||||||||||||||||||||||||||||||||||||||||||||||
| AtGenExpress* (Stress) |
252827_at

X axis is samples (pdf file), and Y axis is log2-expression. |
|||||||||||||||||||||||||||||||||||||||||||||||||||||||||||||||||||||
| AtGenExpress* (Hormone) |
252827_at

X axis is samples (xls file), and Y axis is log-expression. |
|||||||||||||||||||||||||||||||||||||||||||||||||||||||||||||||||||||
| Link to other DBs | ||
| Entrez Gene ID | 830154 |


|
| Refseq ID (protein) | NP_001328605.1 |  |
| NP_195705.1 |  |
|
The preparation time of this page was 0.1 [sec].


