[←][→] ath
| functional annotation | ||||||||||||||||||||||||||||||||||
| Function | cytochrome P450, family 86, subfamily A, polypeptide 1 |


|
||||||||||||||||||||||||||||||||
| GO BP |
|
|||||||||||||||||||||||||||||||||
| GO CC |
|
|||||||||||||||||||||||||||||||||
| GO MF |
|
|||||||||||||||||||||||||||||||||
| KEGG | ath00071 [list] [network] Fatty acid degradation (47 genes) |  |
||||||||||||||||||||||||||||||||
| ath00073 [list] [network] Cutin, suberine and wax biosynthesis (37 genes) |  |
|||||||||||||||||||||||||||||||||
| Protein | NP_200694.1 | |||||||||||||||||||||||||||||||||
| BLAST | NP_200694.1 | |||||||||||||||||||||||||||||||||
| Orthologous | [Ortholog page] LOC4324825 (osa) LOC7468004 (ppo) LOC7481488 (ppo) LOC11410613 (mtr) LOC25490822 (mtr) LOC100787559 (gma) LOC100788343 (gma) LOC101259447 (sly) LOC103851611 (bra) LOC103856662 (bra) LOC123062632 (tae) LOC123071452 (tae) LOC123079793 (tae) LOC123440517 (hvu) | |||||||||||||||||||||||||||||||||
| Subcellular localization wolf |
|
|||||||||||||||||||||||||||||||||
| Subcellular localization TargetP |
|
|||||||||||||||||||||||||||||||||
| Gene coexpression | ||||||||||||||||||||||||||||||||||
| Network*for coexpressed genes |
|
|||||||||||||||||||||||||||||||||
|---|---|---|---|---|---|---|---|---|---|---|---|---|---|---|---|---|---|---|---|---|---|---|---|---|---|---|---|---|---|---|---|---|---|---|
| Coexpressed gene list |
[Coexpressed gene list for CYP86A1] | |||||||||||||||||||||||||||||||||
| Gene expression | ||||||||||||||||||||||||||||||||||
| All samples | [Expression pattern for all samples] | |||||||||||||||||||||||||||||||||
| AtGenExpress* (Development) |
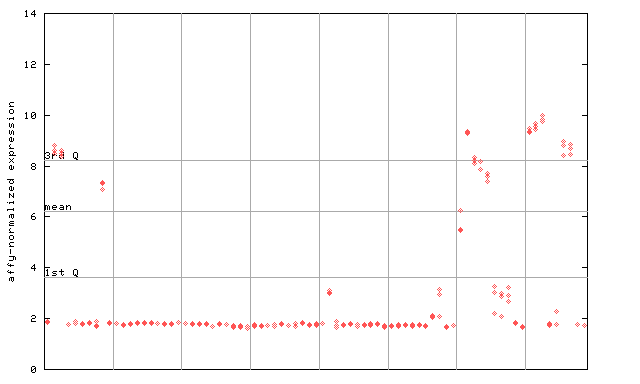
247765_at

X axis is samples (pdf file), and Y axis is log2-expression. |
|||||||||||||||||||||||||||||||||
| AtGenExpress* (Stress) |
247765_at

X axis is samples (pdf file), and Y axis is log2-expression. |
|||||||||||||||||||||||||||||||||
| AtGenExpress* (Hormone) |
247765_at

X axis is samples (xls file), and Y axis is log-expression. |
|||||||||||||||||||||||||||||||||
| Link to other DBs | ||
| Entrez Gene ID | 836003 |


|
| Refseq ID (protein) | NP_200694.1 |  |
The preparation time of this page was 0.1 [sec].


