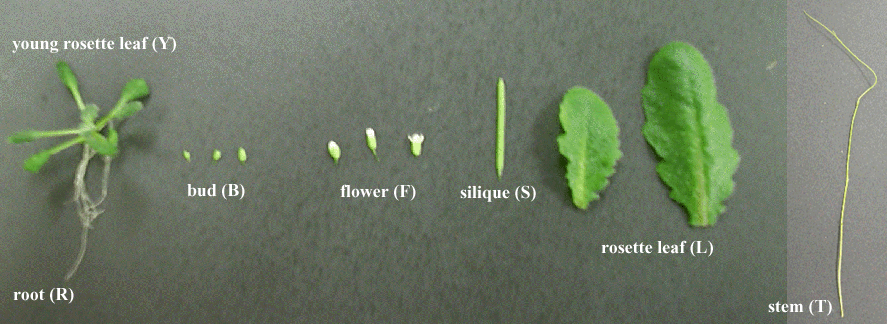
| abbr. | tissues | age | |
|---|---|---|---|
| Y | Young leaf | 2 weeks old | MS plate containing 1% sucrose |
| L | Leaf | 2 months old | soil |
| T | Stem | 3 months old | soil |
| B | Bud | 2 months old | soil |
| F | Flower | 2 months old | soil |
| S | Silique | 2 months old | soil |
| R | Root | 2 weeks old | MS plate containing 1% sucrose |
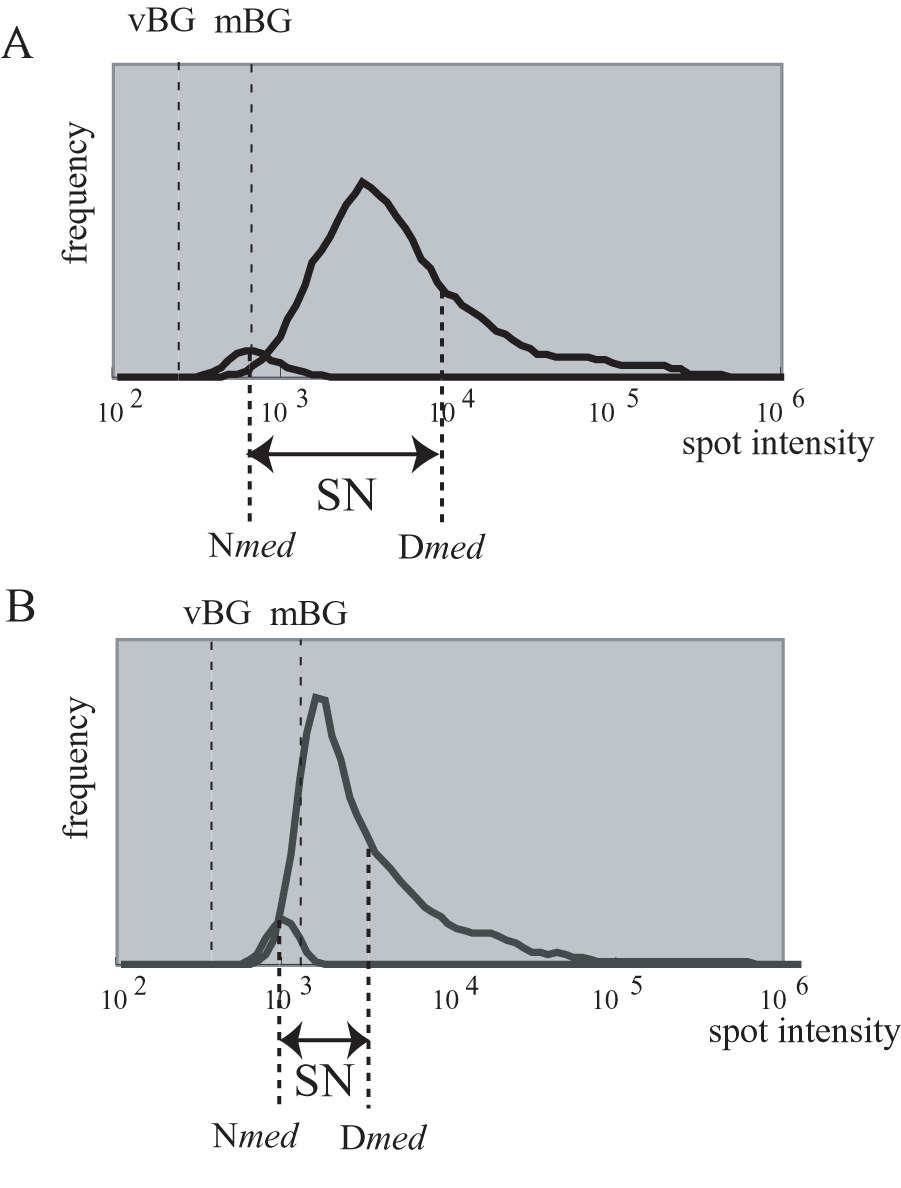 Example of data distribution with high SN (A) and low SN (B) values. mBG, membrane background. vBG, virtual background. SN, signal to noise. Dmed, median of signal intensity for cDNA spots. Nmed, median of signal intensity for negative controls.
|
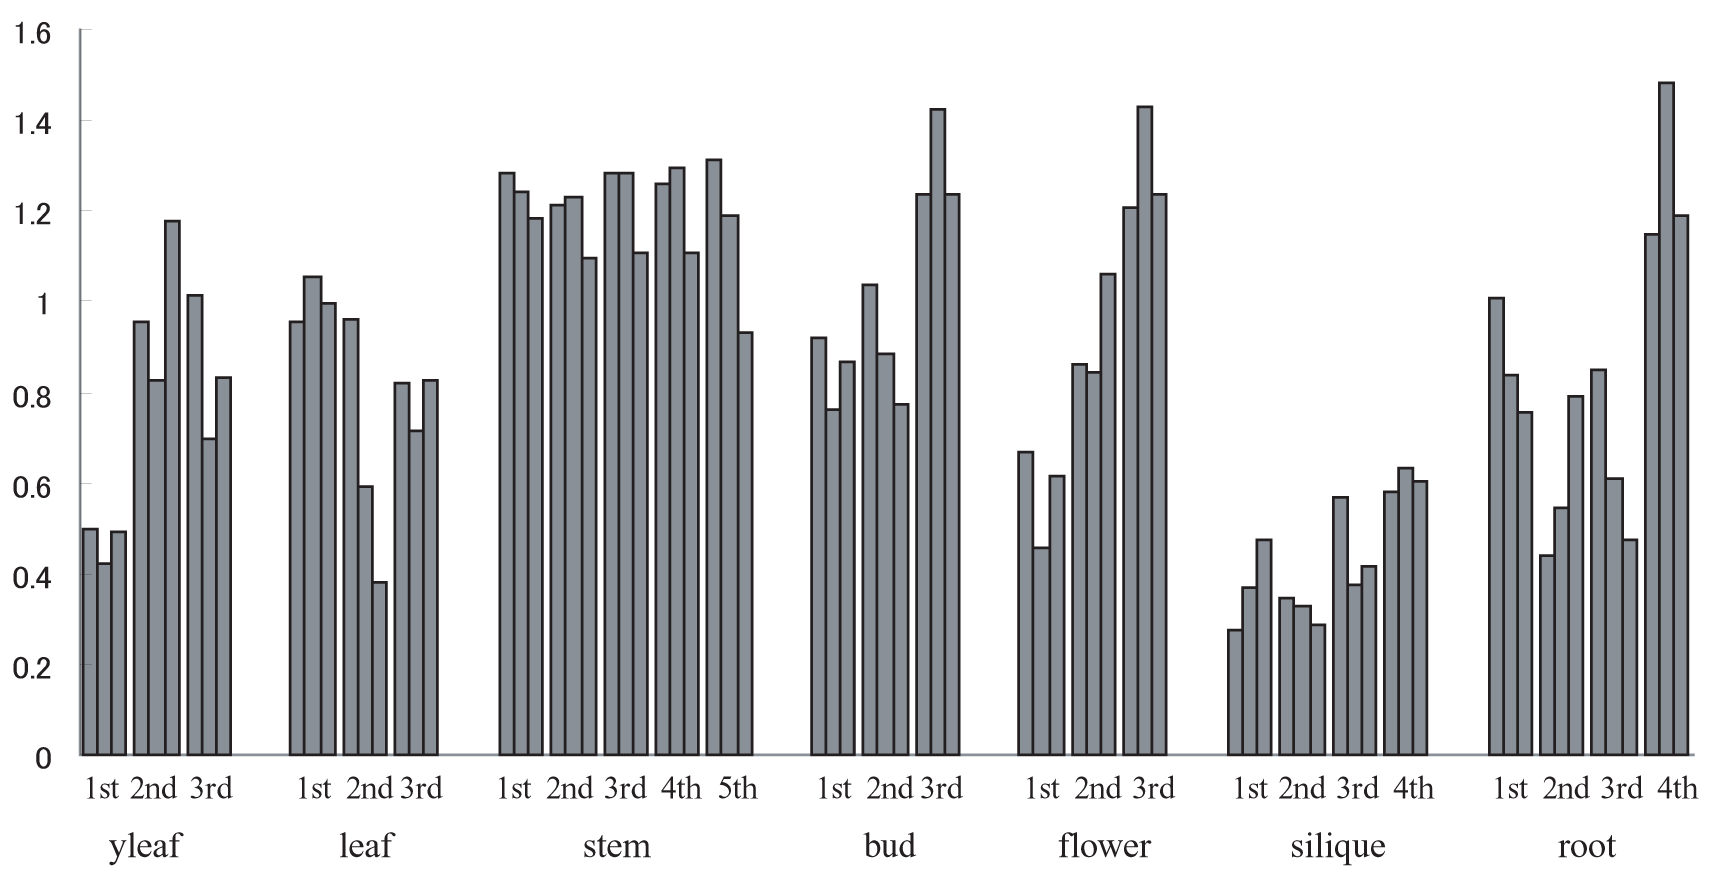 SN values of macroarray data in ATTED. Since 13516 ESTs were spotted on 3 membranes, each tissue has 3 SN values. Experiments were repeated in 3 to 5 times for each tissue.
|