[←][→] ath
| functional annotation | ||||||||||||||||||||||||||||||||||
| Function | helicase in vascular tissue and tapetum |


|
||||||||||||||||||||||||||||||||
| GO BP |
|
|||||||||||||||||||||||||||||||||
| GO CC |
|
|||||||||||||||||||||||||||||||||
| GO MF |
|
|||||||||||||||||||||||||||||||||
| KEGG | ath03018 [list] [network] RNA degradation (113 genes) |  |
||||||||||||||||||||||||||||||||
| Protein | NP_001325350.1 NP_850154.2 | |||||||||||||||||||||||||||||||||
| BLAST | NP_001325350.1 NP_850154.2 | |||||||||||||||||||||||||||||||||
| Orthologous | [Ortholog page] NIH (ath) LOC4325502 (osa) LOC7464663 (ppo) LOC11429946 (mtr) LOC100260829 (vvi) LOC100384291 (zma) LOC100782189 (gma) LOC100810272 (gma) LOC101247633 (sly) LOC103865072 (bra) LOC103867932 (bra) | |||||||||||||||||||||||||||||||||
| Subcellular localization wolf |
|
|||||||||||||||||||||||||||||||||
| Subcellular localization TargetP |
|
|||||||||||||||||||||||||||||||||
| Gene coexpression | ||||||||||||||||||||||||||||||||||
| Network*for coexpressed genes |
|
|||||||||||||||||||||||||||||||||
|---|---|---|---|---|---|---|---|---|---|---|---|---|---|---|---|---|---|---|---|---|---|---|---|---|---|---|---|---|---|---|---|---|---|---|
| Coexpressed gene list |
[Coexpressed gene list for HVT1] | |||||||||||||||||||||||||||||||||
| Gene expression | ||||||||||||||||||||||||||||||||||
| All samples | [Expression pattern for all samples] | |||||||||||||||||||||||||||||||||
| AtGenExpress* (Development) |
267570_at
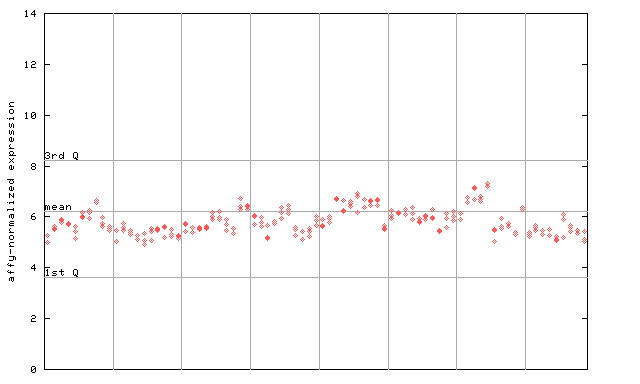
X axis is samples (pdf file), and Y axis is log2-expression. |
|||||||||||||||||||||||||||||||||
| AtGenExpress* (Stress) |
267570_at
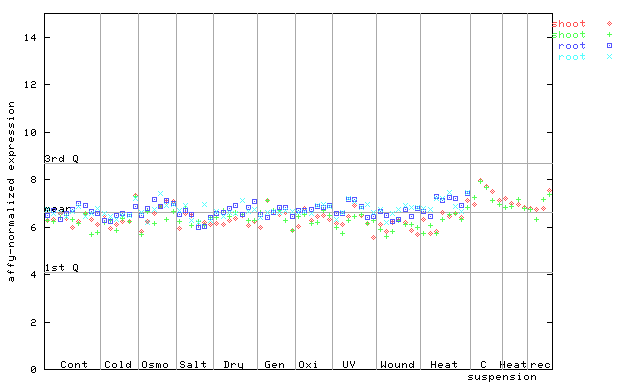
X axis is samples (pdf file), and Y axis is log2-expression. |
|||||||||||||||||||||||||||||||||
| AtGenExpress* (Hormone) |
267570_at
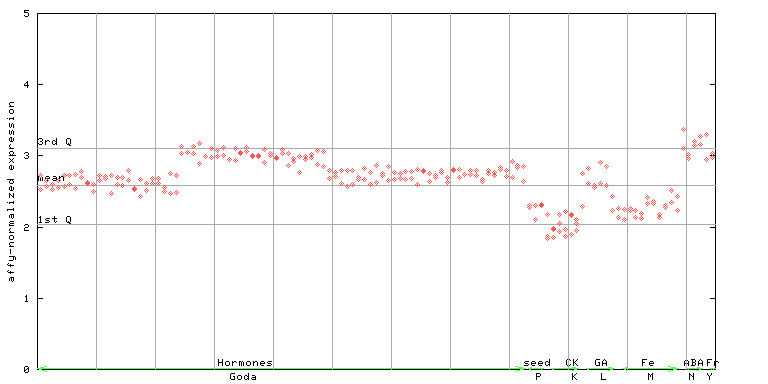
X axis is samples (xls file), and Y axis is log-expression. |
|||||||||||||||||||||||||||||||||


")
| Link to other DBs | ||
| Entrez Gene ID | 817631 |
|
| Refseq ID (protein) | NP_001325350.1 | |
| NP_850154.2 | |
|
The preparation time of this page was 0.1 [sec].