[←][→] ath
| functional annotation | |||||||||||||||||||||||||||||||||||||||
| Function | RNA-binding CRS1 / YhbY (CRM) domain protein |


|
|||||||||||||||||||||||||||||||||||||
| GO BP |
|
||||||||||||||||||||||||||||||||||||||
| GO CC |
|
||||||||||||||||||||||||||||||||||||||
| GO MF |
|
||||||||||||||||||||||||||||||||||||||
| KEGG | ath03018 [list] [network] RNA degradation (113 genes) |  |
|||||||||||||||||||||||||||||||||||||
| Protein | NP_001078207.1 NP_001327056.1 NP_001327057.1 NP_001327058.1 NP_189171.2 | ||||||||||||||||||||||||||||||||||||||
| BLAST | NP_001078207.1 NP_001327056.1 NP_001327057.1 NP_001327058.1 NP_189171.2 | ||||||||||||||||||||||||||||||||||||||
| Orthologous | [Ortholog page] LOC4336259 (osa) LOC7469379 (ppo) LOC11429426 (mtr) LOC100193495 (zma) LOC100252435 (vvi) LOC100775770 (gma) LOC100790692 (gma) LOC101259346 (sly) LOC103828555 (bra) | ||||||||||||||||||||||||||||||||||||||
| Subcellular localization wolf |
|
||||||||||||||||||||||||||||||||||||||
| Subcellular localization TargetP |
|
||||||||||||||||||||||||||||||||||||||
| Gene coexpression | |||||||||||||||||||||||||||||||||||||||
| Network*for coexpressed genes |
|
||||||||||||||||||||||||||||||||||||||
|---|---|---|---|---|---|---|---|---|---|---|---|---|---|---|---|---|---|---|---|---|---|---|---|---|---|---|---|---|---|---|---|---|---|---|---|---|---|---|---|
| Coexpressed gene list |
[Coexpressed gene list for LOH1] | ||||||||||||||||||||||||||||||||||||||
| Gene expression | |||||||||||||||||||||||||||||||||||||||
| All samples | [Expression pattern for all samples] | ||||||||||||||||||||||||||||||||||||||
| AtGenExpress* (Development) |
257935_at
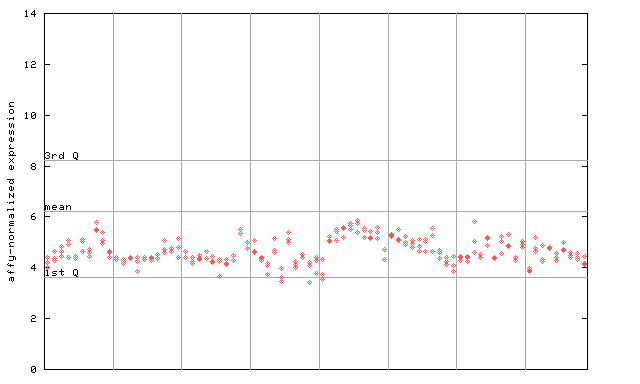
X axis is samples (pdf file), and Y axis is log2-expression. |
||||||||||||||||||||||||||||||||||||||
| AtGenExpress* (Stress) |
257935_at
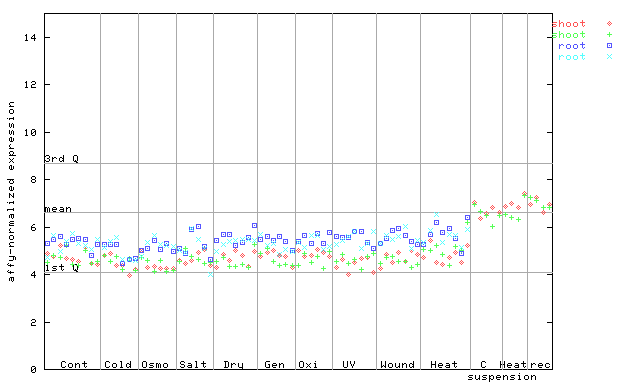
X axis is samples (pdf file), and Y axis is log2-expression. |
||||||||||||||||||||||||||||||||||||||
| AtGenExpress* (Hormone) |
257935_at
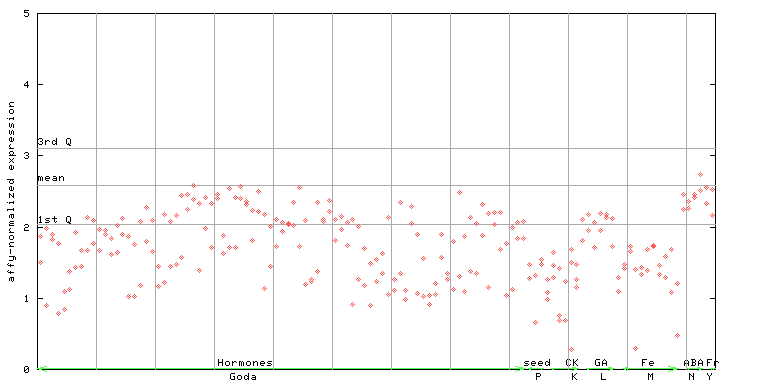
X axis is samples (xls file), and Y axis is log-expression. |
||||||||||||||||||||||||||||||||||||||


")
| Link to other DBs | ||
| Entrez Gene ID | 822128 |
|
| Refseq ID (protein) | NP_001078207.1 | |
| NP_001327056.1 | |
|
| NP_001327057.1 | |
|
| NP_001327058.1 | |
|
| NP_189171.2 | |
|
The preparation time of this page was 0.2 [sec].