[←][→] ath
| functional annotation | ||||||||||||||||||||||||||||||||||||||
| Function | P-loop containing nucleoside triphosphate hydrolases superfamily protein |


|
||||||||||||||||||||||||||||||||||||
| GO BP |
|
|||||||||||||||||||||||||||||||||||||
| GO CC |
|
|||||||||||||||||||||||||||||||||||||
| GO MF |
|
|||||||||||||||||||||||||||||||||||||
| KEGG | ath00240 [list] [network] Pyrimidine metabolism (57 genes) |  |
||||||||||||||||||||||||||||||||||||
| Protein | NP_001320061.1 NP_194258.3 | |||||||||||||||||||||||||||||||||||||
| BLAST | NP_001320061.1 NP_194258.3 | |||||||||||||||||||||||||||||||||||||
| Orthologous | [Ortholog page] LOC4334909 (osa) LOC11405787 (mtr) LOC25491834 (mtr) LOC100248550 (vvi) LOC100283047 (zma) LOC100777369 (gma) LOC100806842 (gma) LOC101249532 (sly) LOC103863071 (bra) | |||||||||||||||||||||||||||||||||||||
| Subcellular localization wolf |
|
|||||||||||||||||||||||||||||||||||||
| Subcellular localization TargetP |
|
|||||||||||||||||||||||||||||||||||||
| Gene coexpression | ||||||||||||||||||||||||||||||||||||||
| Network*for coexpressed genes |
|
|||||||||||||||||||||||||||||||||||||
|---|---|---|---|---|---|---|---|---|---|---|---|---|---|---|---|---|---|---|---|---|---|---|---|---|---|---|---|---|---|---|---|---|---|---|---|---|---|---|
| Coexpressed gene list |
[Coexpressed gene list for AT4G25280] | |||||||||||||||||||||||||||||||||||||
| Gene expression | ||||||||||||||||||||||||||||||||||||||
| All samples | [Expression pattern for all samples] | |||||||||||||||||||||||||||||||||||||
| AtGenExpress* (Development) |
254052_at
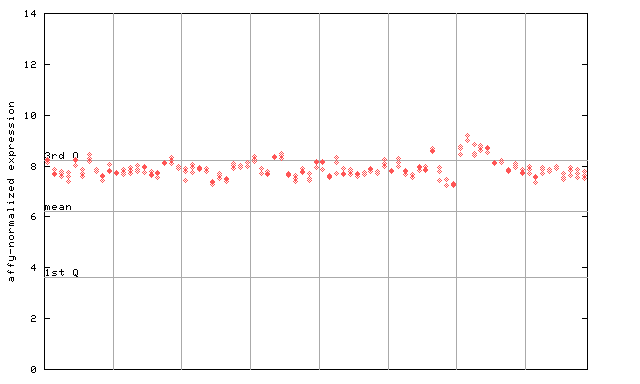
X axis is samples (pdf file), and Y axis is log2-expression. |
|||||||||||||||||||||||||||||||||||||
| AtGenExpress* (Stress) |
254052_at
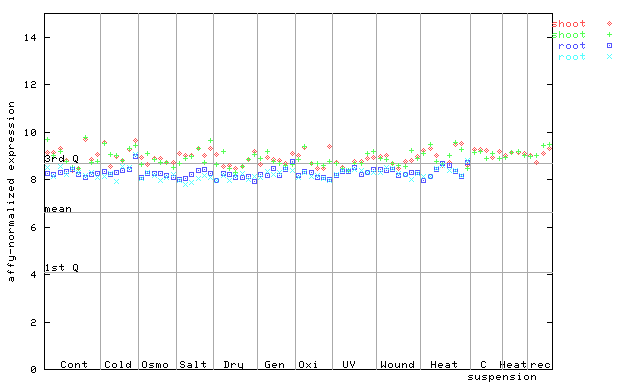
X axis is samples (pdf file), and Y axis is log2-expression. |
|||||||||||||||||||||||||||||||||||||
| AtGenExpress* (Hormone) |
254052_at
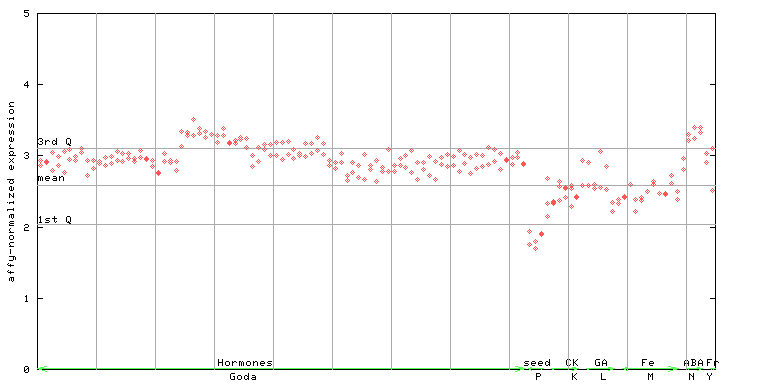
X axis is samples (xls file), and Y axis is log-expression. |
|||||||||||||||||||||||||||||||||||||


")
")
| Link to other DBs | ||
| Entrez Gene ID | 828631 |
|
| Refseq ID (protein) | NP_001320061.1 | |
| NP_194258.3 | |
|
The preparation time of this page was 0.2 [sec].