[←][→] ath
| functional annotation | |||||||||||||||||||||||||||||||||||||||||||||||
| Function | chorismate mutase 2 |


|
|||||||||||||||||||||||||||||||||||||||||||||
| GO BP |
|
||||||||||||||||||||||||||||||||||||||||||||||
| GO CC |
|
||||||||||||||||||||||||||||||||||||||||||||||
| GO MF |
|
||||||||||||||||||||||||||||||||||||||||||||||
| KEGG | ath00400 [list] [network] Phenylalanine, tyrosine and tryptophan biosynthesis (56 genes) |  |
|||||||||||||||||||||||||||||||||||||||||||||
| ath01230 [list] [network] Biosynthesis of amino acids (251 genes) | |
||||||||||||||||||||||||||||||||||||||||||||||
| Protein | NP_196648.1 | ||||||||||||||||||||||||||||||||||||||||||||||
| BLAST | NP_196648.1 | ||||||||||||||||||||||||||||||||||||||||||||||
| Orthologous | [Ortholog page] LOC543970 (sly) LOC4328508 (osa) LOC7465419 (ppo) LOC11426746 (mtr) LOC11428755 (mtr) LOC100191856 (zma) LOC100261098 (vvi) LOC100791095 (gma) LOC100791341 (gma) LOC100808361 (gma) LOC103850294 (bra) | ||||||||||||||||||||||||||||||||||||||||||||||
| Subcellular localization wolf |
|
||||||||||||||||||||||||||||||||||||||||||||||
| Subcellular localization TargetP |
|
||||||||||||||||||||||||||||||||||||||||||||||
| Gene coexpression | |||||||||||||||||||||||||||||||||||||||||||||||
| Network*for coexpressed genes |
|
||||||||||||||||||||||||||||||||||||||||||||||
|---|---|---|---|---|---|---|---|---|---|---|---|---|---|---|---|---|---|---|---|---|---|---|---|---|---|---|---|---|---|---|---|---|---|---|---|---|---|---|---|---|---|---|---|---|---|---|---|
| Coexpressed gene list |
[Coexpressed gene list for CM2] | ||||||||||||||||||||||||||||||||||||||||||||||
| Gene expression | |||||||||||||||||||||||||||||||||||||||||||||||
| All samples | [Expression pattern for all samples] | ||||||||||||||||||||||||||||||||||||||||||||||
| AtGenExpress* (Development) |
250407_at
X axis is samples (pdf file), and Y axis is log2-expression. |
||||||||||||||||||||||||||||||||||||||||||||||
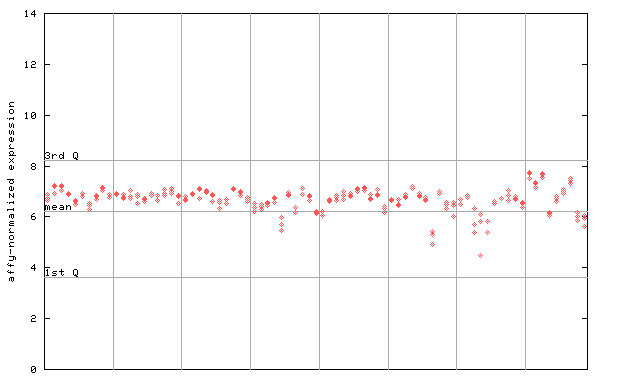
| AtGenExpress* (Stress) |
250407_at
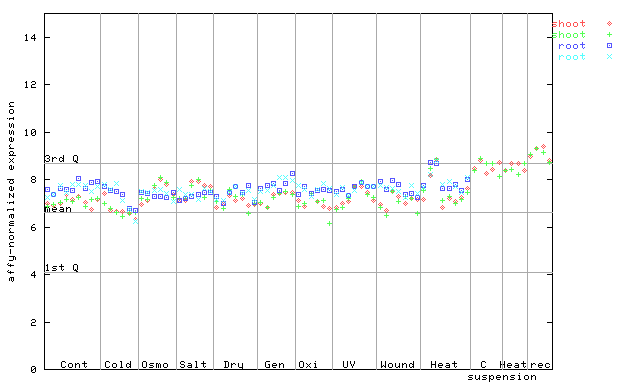
X axis is samples (pdf file), and Y axis is log2-expression. |
||||||||||||||||||||||||||||||||||||||||||||||
| AtGenExpress* (Hormone) |
250407_at
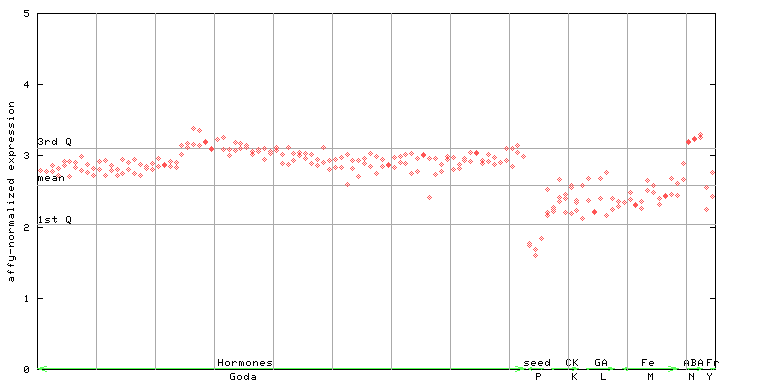
X axis is samples (xls file), and Y axis is log-expression. |
||||||||||||||||||||||||||||||||||||||||||||||


")
")
")
| Link to other DBs | ||
| Entrez Gene ID | 830954 |
|
| Refseq ID (protein) | NP_196648.1 | |
The preparation time of this page was 0.2 [sec].