[←][→] ath
| functional annotation | |||||||||||||||||||||||||||||||||||||||||||
| Function | transcription regulator NOT2/NOT3/NOT5 family protein |


|
|||||||||||||||||||||||||||||||||||||||||
| GO BP |
|
||||||||||||||||||||||||||||||||||||||||||
| GO CC |
|
||||||||||||||||||||||||||||||||||||||||||
| GO MF |
|
||||||||||||||||||||||||||||||||||||||||||
| KEGG | ath03018 [list] [network] RNA degradation (113 genes) |  |
|||||||||||||||||||||||||||||||||||||||||
| Protein | NP_001154716.1 NP_001330084.1 NP_001330085.1 NP_568361.1 | ||||||||||||||||||||||||||||||||||||||||||
| BLAST | NP_001154716.1 NP_001330084.1 NP_001330085.1 NP_568361.1 | ||||||||||||||||||||||||||||||||||||||||||
| Orthologous | [Ortholog page] LOC4333598 (osa) LOC11437872 (mtr) LOC100193927 (zma) LOC100253711 (vvi) LOC100780204 (gma) LOC100783415 (gma) LOC100785965 (gma) LOC100819202 (gma) LOC101245924 (sly) LOC103643788 (zma) LOC103845854 (bra) LOC103856292 (bra) LOC103856293 (bra) | ||||||||||||||||||||||||||||||||||||||||||
| Subcellular localization wolf |
|
||||||||||||||||||||||||||||||||||||||||||
| Subcellular localization TargetP |
|
||||||||||||||||||||||||||||||||||||||||||
| Gene coexpression | |||||||||||||||||||||||||||||||||||||||||||
| Network*for coexpressed genes |
|
||||||||||||||||||||||||||||||||||||||||||
|---|---|---|---|---|---|---|---|---|---|---|---|---|---|---|---|---|---|---|---|---|---|---|---|---|---|---|---|---|---|---|---|---|---|---|---|---|---|---|---|---|---|---|---|
| Coexpressed gene list |
[Coexpressed gene list for AT5G18230] | ||||||||||||||||||||||||||||||||||||||||||
| Gene expression | |||||||||||||||||||||||||||||||||||||||||||
| All samples | [Expression pattern for all samples] | ||||||||||||||||||||||||||||||||||||||||||
| AtGenExpress* (Development) |
250035_at
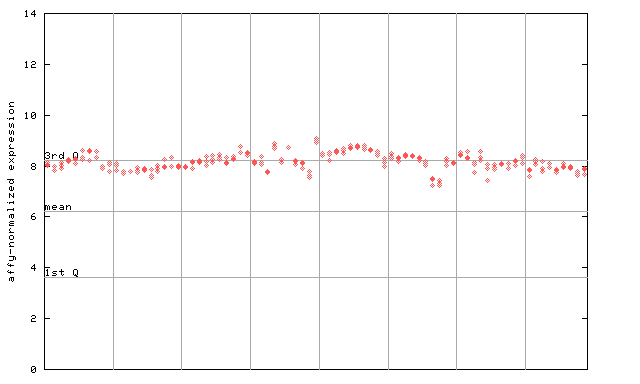
X axis is samples (pdf file), and Y axis is log2-expression. |
||||||||||||||||||||||||||||||||||||||||||
| AtGenExpress* (Stress) |
250035_at
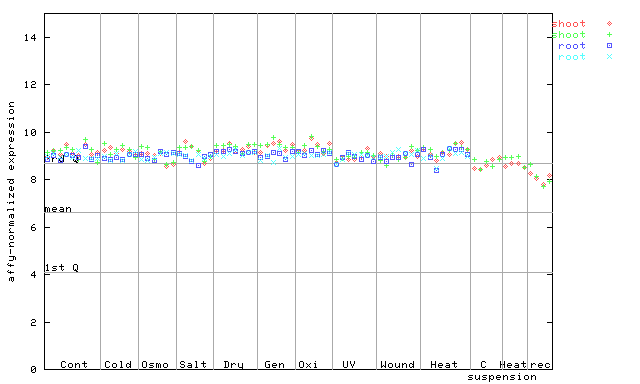
X axis is samples (pdf file), and Y axis is log2-expression. |
||||||||||||||||||||||||||||||||||||||||||
| AtGenExpress* (Hormone) |
250035_at
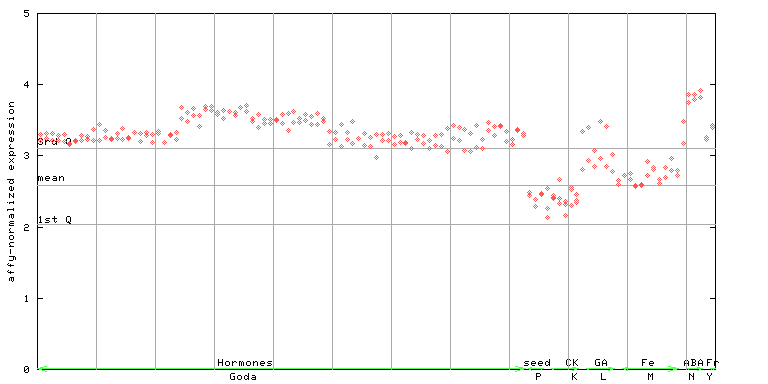
X axis is samples (xls file), and Y axis is log-expression. |
||||||||||||||||||||||||||||||||||||||||||


")
")
| Link to other DBs | ||
| Entrez Gene ID | 831941 |
|
| Refseq ID (protein) | NP_001154716.1 | |
| NP_001330084.1 | |
|
| NP_001330085.1 | |
|
| NP_568361.1 | |
|
The preparation time of this page was 0.1 [sec].