[←][→] ath
| functional annotation | ||||||||||||||||||||||||||||||||||
| Function | sensitivity to red light reduced protein (SRR1) |


|
||||||||||||||||||||||||||||||||
| GO BP |
|
|||||||||||||||||||||||||||||||||
| GO CC |
|
|||||||||||||||||||||||||||||||||
| GO MF |
|
|||||||||||||||||||||||||||||||||
| KEGG | ||||||||||||||||||||||||||||||||||
| Protein | NP_200764.1 NP_851224.1 | |||||||||||||||||||||||||||||||||
| BLAST | NP_200764.1 NP_851224.1 | |||||||||||||||||||||||||||||||||
| Orthologous | [Ortholog page] LOC4337632 (osa) LOC7476849 (ppo) LOC11419761 (mtr) LOC100251366 (vvi) LOC100285750 (zma) LOC100798856 (gma) LOC100812408 (gma) LOC101260100 (sly) LOC101260783 (sly) LOC103845377 (bra) LOC103851571 (bra) LOC104644442 (sly) LOC104644443 (sly) LOC112941659 (sly) | |||||||||||||||||||||||||||||||||
| Subcellular localization wolf |
|
|||||||||||||||||||||||||||||||||
| Subcellular localization TargetP |
|
|||||||||||||||||||||||||||||||||
| Gene coexpression | ||||||||||||||||||||||||||||||||||
| Network*for coexpressed genes |
|
|||||||||||||||||||||||||||||||||
|---|---|---|---|---|---|---|---|---|---|---|---|---|---|---|---|---|---|---|---|---|---|---|---|---|---|---|---|---|---|---|---|---|---|---|
| Coexpressed gene list |
[Coexpressed gene list for SRR1] | |||||||||||||||||||||||||||||||||
| Gene expression | ||||||||||||||||||||||||||||||||||
| All samples | [Expression pattern for all samples] | |||||||||||||||||||||||||||||||||
| AtGenExpress* (Development) |
247703_at
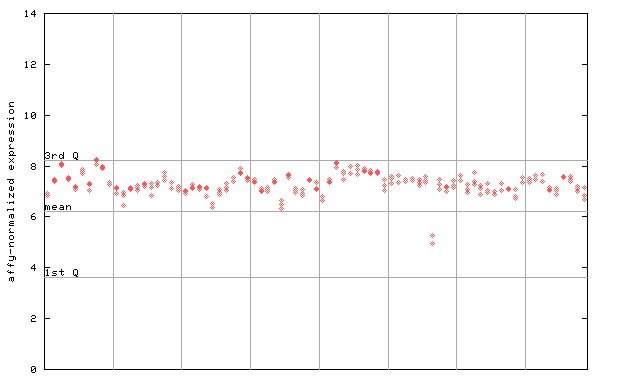
X axis is samples (pdf file), and Y axis is log2-expression. |
|||||||||||||||||||||||||||||||||
| AtGenExpress* (Stress) |
247703_at
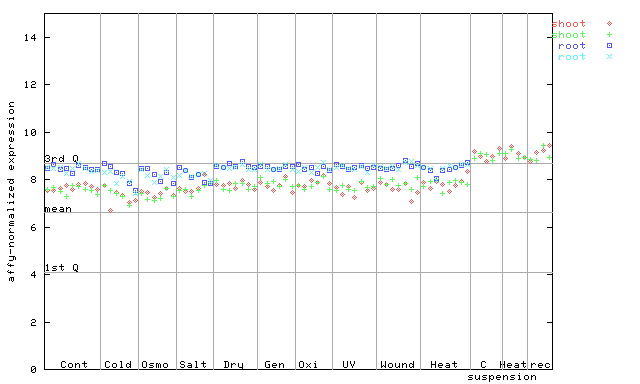
X axis is samples (pdf file), and Y axis is log2-expression. |
|||||||||||||||||||||||||||||||||
| AtGenExpress* (Hormone) |
247703_at
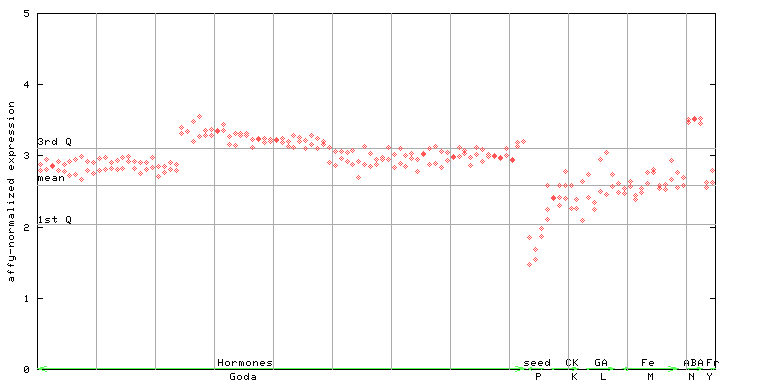
X axis is samples (xls file), and Y axis is log-expression. |
|||||||||||||||||||||||||||||||||


")
| Link to other DBs | ||
| Entrez Gene ID | 836075 |
|
| Refseq ID (protein) | NP_200764.1 | |
| NP_851224.1 | |
|
The preparation time of this page was 0.2 [sec].