[←][→] ath
| functional annotation | |||||||||||||||||||||||||||||||
| Function | splicing endonuclease 2 |


|
|||||||||||||||||||||||||||||
| GO BP |
|
||||||||||||||||||||||||||||||
| GO CC |
|
||||||||||||||||||||||||||||||
| GO MF |
|
||||||||||||||||||||||||||||||
| KEGG | |||||||||||||||||||||||||||||||
| Protein | NP_200831.1 NP_974966.1 | ||||||||||||||||||||||||||||||
| BLAST | NP_200831.1 NP_974966.1 | ||||||||||||||||||||||||||||||
| Orthologous | [Ortholog page] SEN1 (ath) AT3G45577 (ath) LOC4341203 (osa) LOC4350867 (osa) LOC7472137 (ppo) LOC11414349 (mtr) LOC100255233 (vvi) LOC100282606 (zma) LOC100807021 (gma) LOC100810335 (gma) LOC101260236 (sly) LOC103845434 (bra) LOC103856576 (bra) LOC107280434 (osa) | ||||||||||||||||||||||||||||||
| Subcellular localization wolf |
|
||||||||||||||||||||||||||||||
| Subcellular localization TargetP |
|
||||||||||||||||||||||||||||||
| Gene coexpression | |||||||||||||||||||||||||||||||
| Network*for coexpressed genes |
|
||||||||||||||||||||||||||||||
|---|---|---|---|---|---|---|---|---|---|---|---|---|---|---|---|---|---|---|---|---|---|---|---|---|---|---|---|---|---|---|---|
| Coexpressed gene list |
[Coexpressed gene list for SEN2] | ||||||||||||||||||||||||||||||
| Gene expression | |||||||||||||||||||||||||||||||
| All samples | [Expression pattern for all samples] | ||||||||||||||||||||||||||||||
| AtGenExpress* (Development) |
247673_at
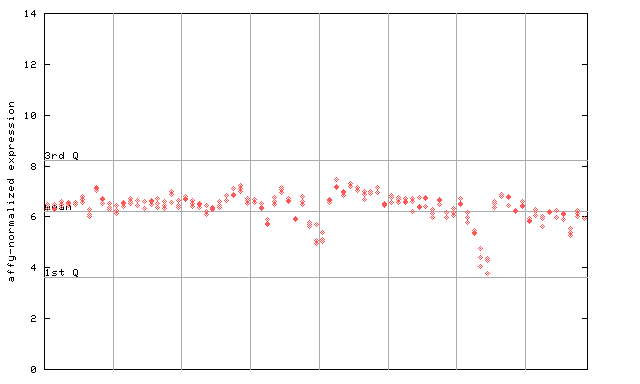
X axis is samples (pdf file), and Y axis is log2-expression. |
||||||||||||||||||||||||||||||
| AtGenExpress* (Stress) |
247673_at
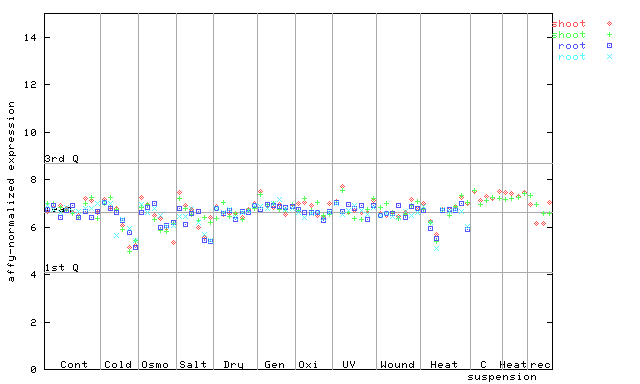
X axis is samples (pdf file), and Y axis is log2-expression. |
||||||||||||||||||||||||||||||
| AtGenExpress* (Hormone) |
247673_at
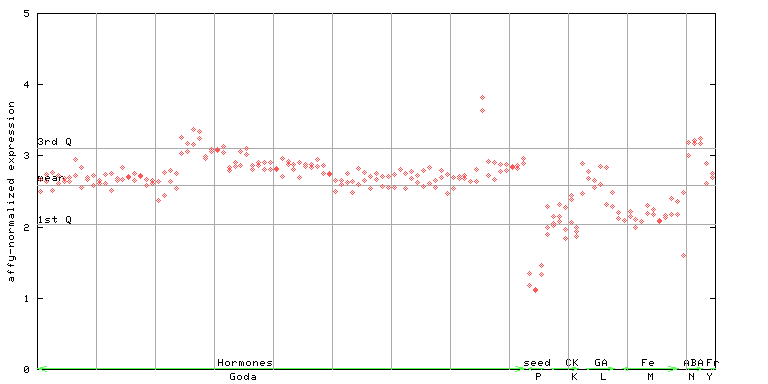
X axis is samples (xls file), and Y axis is log-expression. |
||||||||||||||||||||||||||||||


| Link to other DBs | ||
| Entrez Gene ID | 836145 |
|
| Refseq ID (protein) | NP_200831.1 | |
| NP_974966.1 | |
|
The preparation time of this page was 0.2 [sec].