[←][→] ath
| functional annotation | ||||||||||
| Function | hypothetical protein |


|
||||||||
| GO BP |
|
|||||||||
| GO CC |
|
|||||||||
| GO MF |
|
|||||||||
| KEGG | ||||||||||
| Protein | NP_001077548.1 NP_001321384.1 NP_173121.1 | |||||||||
| BLAST | NP_001077548.1 NP_001321384.1 NP_173121.1 | |||||||||
| Orthologous | [Ortholog page] LOC4328263 (osa) LOC25488020 (mtr) LOC100263288 (vvi) LOC101264914 (sly) LOC103633444 (zma) LOC103835986 (bra) | |||||||||
| Subcellular localization wolf |
|
|||||||||
| Subcellular localization TargetP |
|
|||||||||
| Gene coexpression | ||||||||||
| Network*for coexpressed genes |
||||||||||
|---|---|---|---|---|---|---|---|---|---|---|
| Coexpressed gene list |
[Coexpressed gene list for AT1G16770] | |||||||||
| Gene expression | ||||||||||
| All samples | [Expression pattern for all samples] | |||||||||
| AtGenExpress* (Development) |
255761_at
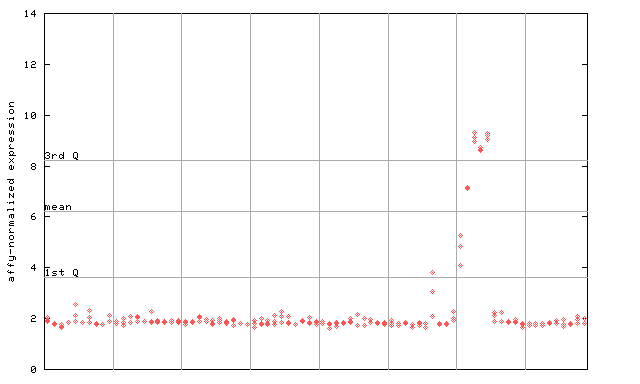
X axis is samples (pdf file), and Y axis is log2-expression. |
|||||||||
| AtGenExpress* (Stress) |
255761_at
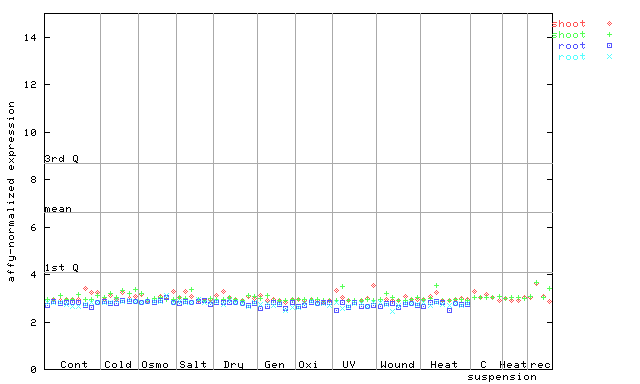
X axis is samples (pdf file), and Y axis is log2-expression. |
|||||||||
| AtGenExpress* (Hormone) |
255761_at
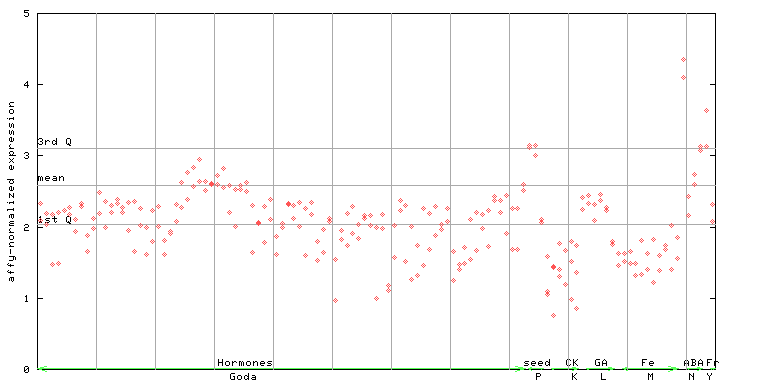
X axis is samples (xls file), and Y axis is log-expression. |
|||||||||

| Link to other DBs | ||
| Entrez Gene ID | 838248 |
|
| Refseq ID (protein) | NP_001077548.1 | |
| NP_001321384.1 | |
|
| NP_173121.1 | |
|
The preparation time of this page was 0.1 [sec].