[←][→] ath
| functional annotation | ||||||||||||||||||||||||||||||||||
| Function | Inorganic H pyrophosphatase family protein |


|
||||||||||||||||||||||||||||||||
| GO BP |
|
|||||||||||||||||||||||||||||||||
| GO CC |
|
|||||||||||||||||||||||||||||||||
| GO MF |
|
|||||||||||||||||||||||||||||||||
| KEGG | ||||||||||||||||||||||||||||||||||
| Protein | NP_001319021.1 NP_001323031.1 NP_001323032.1 | |||||||||||||||||||||||||||||||||
| BLAST | NP_001319021.1 NP_001323031.1 NP_001323032.1 | |||||||||||||||||||||||||||||||||
| Orthologous | [Ortholog page] VP2 (ath) LOC4329579 (osa) LOC7469460 (ppo) LOC25491158 (mtr) LOC100126542 (zma) LOC100247980 (vvi) LOC100784465 (gma) LOC100787805 (gma) LeVP3 (sly) LOC103650470 (zma) LOC103832369 (bra) LOC103853151 (bra) | |||||||||||||||||||||||||||||||||
| Subcellular localization wolf |
|
|||||||||||||||||||||||||||||||||
| Subcellular localization TargetP |
|
|||||||||||||||||||||||||||||||||
| Gene coexpression | ||||||||||||||||||||||||||||||||||
| Network*for coexpressed genes |
|
|||||||||||||||||||||||||||||||||
|---|---|---|---|---|---|---|---|---|---|---|---|---|---|---|---|---|---|---|---|---|---|---|---|---|---|---|---|---|---|---|---|---|---|---|
| Coexpressed gene list |
[Coexpressed gene list for VHP2;2] | |||||||||||||||||||||||||||||||||
| Gene expression | ||||||||||||||||||||||||||||||||||
| All samples | [Expression pattern for all samples] | |||||||||||||||||||||||||||||||||
| AtGenExpress* (Development) |
255760_at
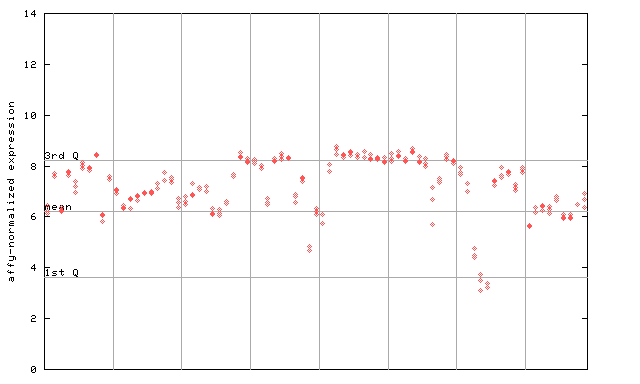
X axis is samples (pdf file), and Y axis is log2-expression. |
|||||||||||||||||||||||||||||||||
| AtGenExpress* (Stress) |
255760_at
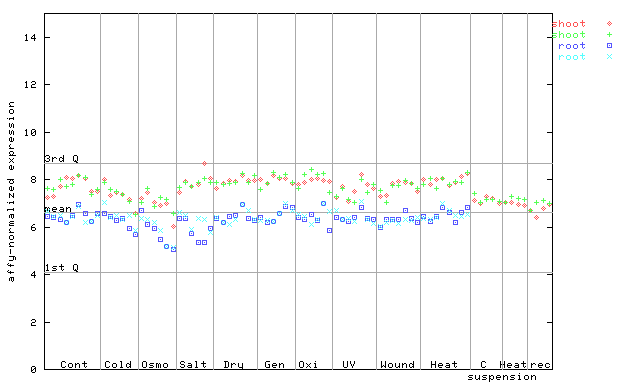
X axis is samples (pdf file), and Y axis is log2-expression. |
|||||||||||||||||||||||||||||||||
| AtGenExpress* (Hormone) |
255760_at
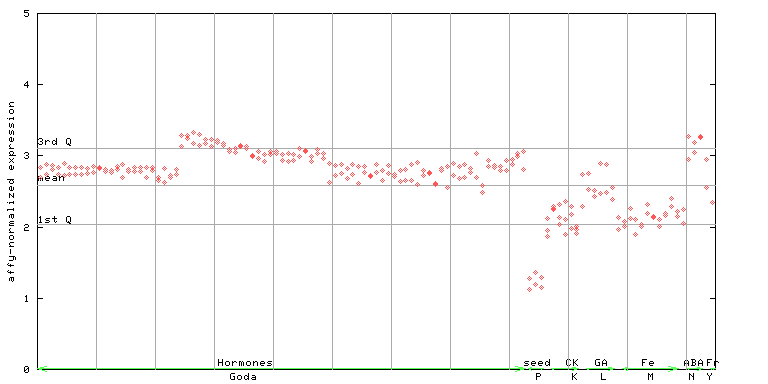
X axis is samples (xls file), and Y axis is log-expression. |
|||||||||||||||||||||||||||||||||


")
| Link to other DBs | ||
| Entrez Gene ID | 838249 |
|
| Refseq ID (protein) | NP_001319021.1 | |
| NP_001323031.1 | |
|
| NP_001323032.1 | |
|
The preparation time of this page was 0.2 [sec].