[←][→] ath
| functional annotation | |||||||||||||||||||||||||||||||||||||||
| Function | isochorismate synthase 2 |


|
|||||||||||||||||||||||||||||||||||||
| GO BP |
|
||||||||||||||||||||||||||||||||||||||
| GO CC |
|
||||||||||||||||||||||||||||||||||||||
| GO MF |
|
||||||||||||||||||||||||||||||||||||||
| KEGG | ath00130 [list] [network] Ubiquinone and other terpenoid-quinone biosynthesis (38 genes) |  |
|||||||||||||||||||||||||||||||||||||
| Protein | NP_001154351.1 NP_001321112.1 NP_173321.4 | ||||||||||||||||||||||||||||||||||||||
| BLAST | NP_001154351.1 NP_001321112.1 NP_173321.4 | ||||||||||||||||||||||||||||||||||||||
| Orthologous | [Ortholog page] LOC778225 (sly) EDS16 (ath) LOC7484749 (ppo) LOC9268489 (osa) LOC11439713 (mtr) LOC100243400 (vvi) LOC100275708 (zma) ICS1 (gma) LOC100804974 (gma) LOC103830688 (bra) LOC103835877 (bra) LOC103852920 (bra) LOC103872693 (bra) | ||||||||||||||||||||||||||||||||||||||
| Subcellular localization wolf |
|
||||||||||||||||||||||||||||||||||||||
| Subcellular localization TargetP |
|
||||||||||||||||||||||||||||||||||||||
| Gene coexpression | |||||||||||||||||||||||||||||||||||||||
| Network*for coexpressed genes |
|
||||||||||||||||||||||||||||||||||||||
|---|---|---|---|---|---|---|---|---|---|---|---|---|---|---|---|---|---|---|---|---|---|---|---|---|---|---|---|---|---|---|---|---|---|---|---|---|---|---|---|
| Coexpressed gene list |
[Coexpressed gene list for ICS2] | ||||||||||||||||||||||||||||||||||||||
| Gene expression | |||||||||||||||||||||||||||||||||||||||
| All samples | [Expression pattern for all samples] | ||||||||||||||||||||||||||||||||||||||
| AtGenExpress* (Development) |
261428_at
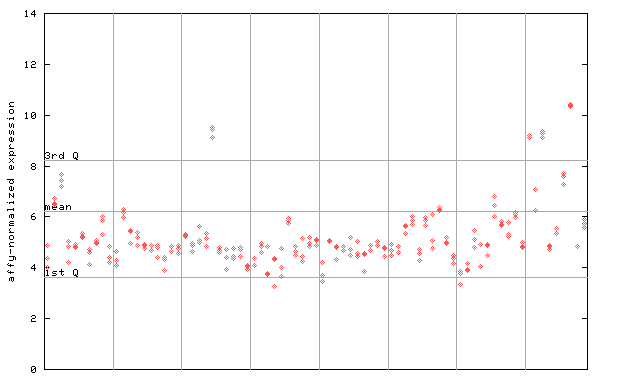
X axis is samples (pdf file), and Y axis is log2-expression. |
||||||||||||||||||||||||||||||||||||||
| AtGenExpress* (Stress) |
261428_at
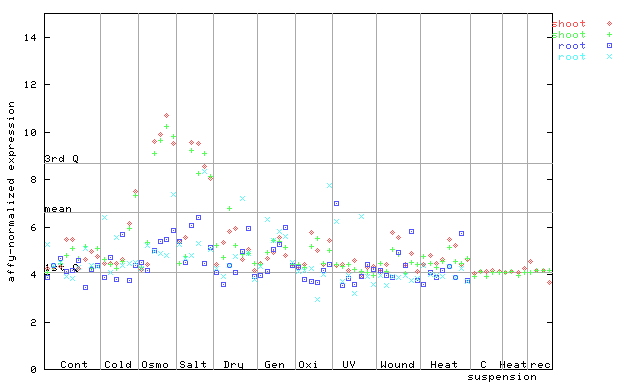
X axis is samples (pdf file), and Y axis is log2-expression. |
||||||||||||||||||||||||||||||||||||||
| AtGenExpress* (Hormone) |
261428_at
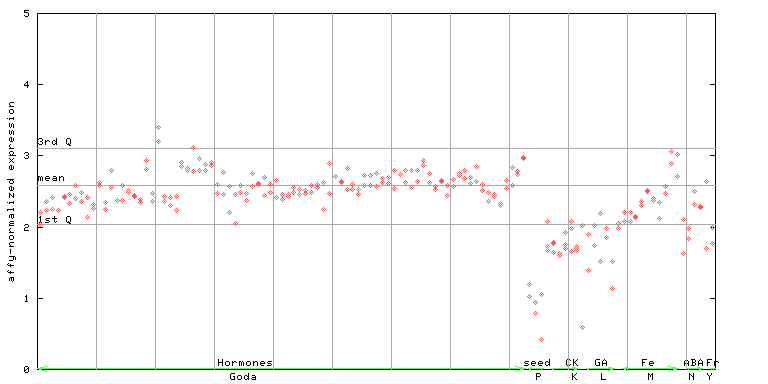
X axis is samples (xls file), and Y axis is log-expression. |
||||||||||||||||||||||||||||||||||||||


")
| Link to other DBs | ||
| Entrez Gene ID | 838468 |
|
| Refseq ID (protein) | NP_001154351.1 | |
| NP_001321112.1 | |
|
| NP_173321.4 | |
|
The preparation time of this page was 0.2 [sec].