[←][→] ath
| functional annotation | ||||||||||||||||||||||||||||||||||
| Function | PDI-like 1-5 |


|
||||||||||||||||||||||||||||||||
| GO BP |
|
|||||||||||||||||||||||||||||||||
| GO CC |
|
|||||||||||||||||||||||||||||||||
| GO MF |
|
|||||||||||||||||||||||||||||||||
| KEGG | ath04141 [list] [network] Protein processing in endoplasmic reticulum (211 genes) |  |
||||||||||||||||||||||||||||||||
| Protein | NP_175636.2 | |||||||||||||||||||||||||||||||||
| BLAST | NP_175636.2 | |||||||||||||||||||||||||||||||||
| Orthologous | [Ortholog page] LOC606418 (zma) PDIL1-6 (ath) LOC4340223 (osa) LOC11436358 (mtr) LOC100265209 (vvi) LOC100305460 (gma) LOC100526845 (gma) LOC101262499 (sly) LOC103832802 (bra) LOC103871222 (bra) | |||||||||||||||||||||||||||||||||
| Subcellular localization wolf |
|
|||||||||||||||||||||||||||||||||
| Subcellular localization TargetP |
|
|||||||||||||||||||||||||||||||||
| Gene coexpression | ||||||||||||||||||||||||||||||||||
| Network*for coexpressed genes |
|
|||||||||||||||||||||||||||||||||
|---|---|---|---|---|---|---|---|---|---|---|---|---|---|---|---|---|---|---|---|---|---|---|---|---|---|---|---|---|---|---|---|---|---|---|
| Coexpressed gene list |
[Coexpressed gene list for PDIL1-5] | |||||||||||||||||||||||||||||||||
| Gene expression | ||||||||||||||||||||||||||||||||||
| All samples | [Expression pattern for all samples] | |||||||||||||||||||||||||||||||||
| AtGenExpress* (Development) |
259637_at
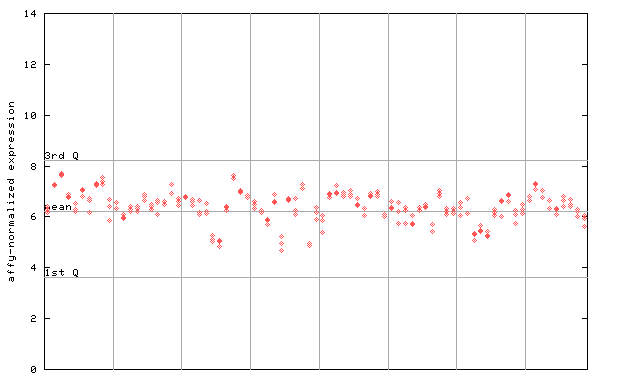
X axis is samples (pdf file), and Y axis is log2-expression. |
|||||||||||||||||||||||||||||||||
| AtGenExpress* (Stress) |
259637_at
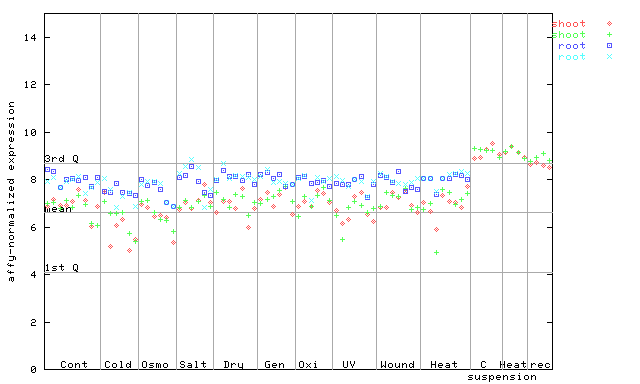
X axis is samples (pdf file), and Y axis is log2-expression. |
|||||||||||||||||||||||||||||||||
| AtGenExpress* (Hormone) |
259637_at
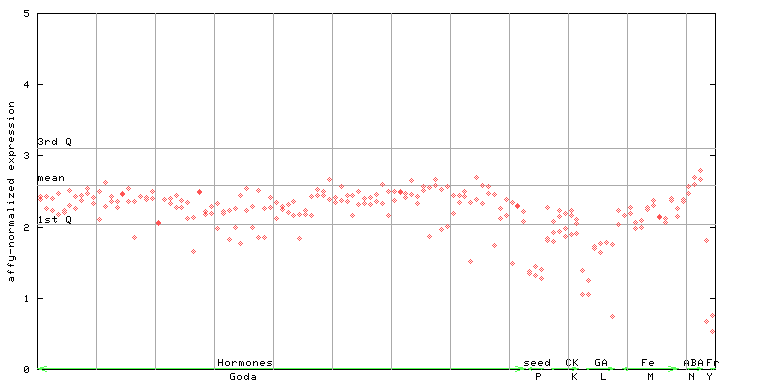
X axis is samples (xls file), and Y axis is log-expression. |
|||||||||||||||||||||||||||||||||


")
| Link to other DBs | ||
| Entrez Gene ID | 841656 |
|
| Refseq ID (protein) | NP_175636.2 | |
The preparation time of this page was 0.2 [sec].