[←][→] ath
| functional annotation | |||||||||||||||||||||||||||||||
| Function | NAD(P)-binding Rossmann-fold superfamily protein |


|
|||||||||||||||||||||||||||||
| GO BP |
|
||||||||||||||||||||||||||||||
| GO CC |
|
||||||||||||||||||||||||||||||
| GO MF |
|
||||||||||||||||||||||||||||||
| KEGG | ath00960 [list] [network] Tropane, piperidine and pyridine alkaloid biosynthesis (35 genes) |  |
|||||||||||||||||||||||||||||
| Protein | NP_172225.1 | ||||||||||||||||||||||||||||||
| BLAST | NP_172225.1 | ||||||||||||||||||||||||||||||
| Orthologous | [Ortholog page] LOC103843456 (bra) | ||||||||||||||||||||||||||||||
| Subcellular localization wolf |
|
||||||||||||||||||||||||||||||
| Subcellular localization TargetP |
|
||||||||||||||||||||||||||||||
| Gene coexpression | |||||||||||||||||||||||||||||||
| Network*for coexpressed genes |
|
||||||||||||||||||||||||||||||
|---|---|---|---|---|---|---|---|---|---|---|---|---|---|---|---|---|---|---|---|---|---|---|---|---|---|---|---|---|---|---|---|
| Coexpressed gene list |
[Coexpressed gene list for AT1G07450] | ||||||||||||||||||||||||||||||
| Gene expression | |||||||||||||||||||||||||||||||
| All samples | [Expression pattern for all samples] | ||||||||||||||||||||||||||||||
| AtGenExpress* (Development) |
261068_at
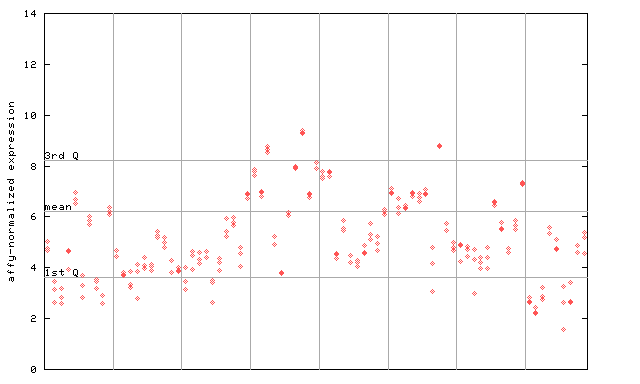
X axis is samples (pdf file), and Y axis is log2-expression. |
||||||||||||||||||||||||||||||
| AtGenExpress* (Stress) |
261068_at
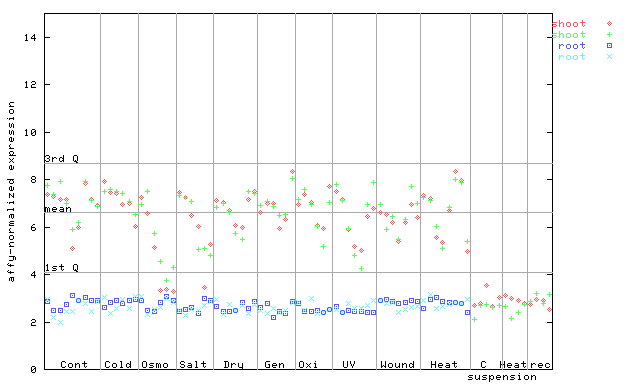
X axis is samples (pdf file), and Y axis is log2-expression. |
||||||||||||||||||||||||||||||
| AtGenExpress* (Hormone) |
261068_at
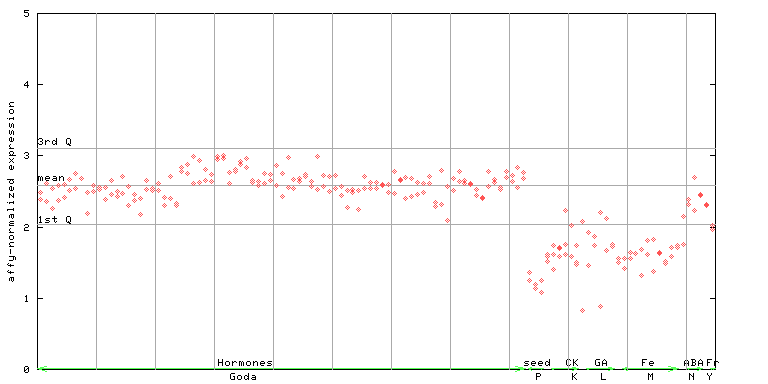
X axis is samples (xls file), and Y axis is log-expression. |
||||||||||||||||||||||||||||||


| Link to other DBs | ||
| Entrez Gene ID | 837257 |
|
| Refseq ID (protein) | NP_172225.1 | |
The preparation time of this page was 0.2 [sec].