[←][→] ath
| functional annotation | ||||||||||||||||||||||||||||||||||||||||||||||
| Function | ATP-dependent caseinolytic (Clp) protease/crotonase family protein |


|
||||||||||||||||||||||||||||||||||||||||||||
| GO BP |
|
|||||||||||||||||||||||||||||||||||||||||||||
| GO CC |
|
|||||||||||||||||||||||||||||||||||||||||||||
| GO MF |
|
|||||||||||||||||||||||||||||||||||||||||||||
| KEGG | ||||||||||||||||||||||||||||||||||||||||||||||
| Protein | NP_001031008.1 NP_001184945.1 NP_563836.1 | |||||||||||||||||||||||||||||||||||||||||||||
| BLAST | NP_001031008.1 NP_001184945.1 NP_563836.1 | |||||||||||||||||||||||||||||||||||||||||||||
| Orthologous | [Ortholog page] LOC4332811 (osa) LOC7481734 (ppo) LOC11434169 (mtr) LOC100818038 (gma) LOC101253726 (sly) LOC103836358 (bra) LOC123085850 (tae) LOC123091978 (tae) LOC123097501 (tae) LOC123448625 (hvu) | |||||||||||||||||||||||||||||||||||||||||||||
| Subcellular localization wolf |
|
|||||||||||||||||||||||||||||||||||||||||||||
| Subcellular localization TargetP |
|
|||||||||||||||||||||||||||||||||||||||||||||
| Gene coexpression | ||||||||||||||||||||||||||||||||||||||||||||||
| Network*for coexpressed genes |
|
|||||||||||||||||||||||||||||||||||||||||||||
|---|---|---|---|---|---|---|---|---|---|---|---|---|---|---|---|---|---|---|---|---|---|---|---|---|---|---|---|---|---|---|---|---|---|---|---|---|---|---|---|---|---|---|---|---|---|---|
| Coexpressed gene list |
[Coexpressed gene list for AT1G09130] | |||||||||||||||||||||||||||||||||||||||||||||
| Gene expression | ||||||||||||||||||||||||||||||||||||||||||||||
| All samples | [Expression pattern for all samples] | |||||||||||||||||||||||||||||||||||||||||||||
| AtGenExpress* (Development) |
264641_at
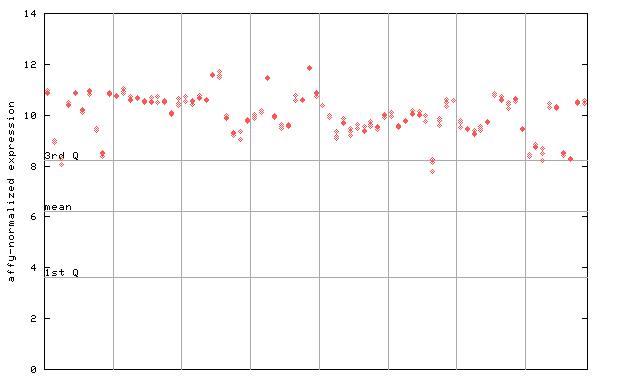
X axis is samples (pdf file), and Y axis is log2-expression. |
|||||||||||||||||||||||||||||||||||||||||||||
| AtGenExpress* (Stress) |
264641_at
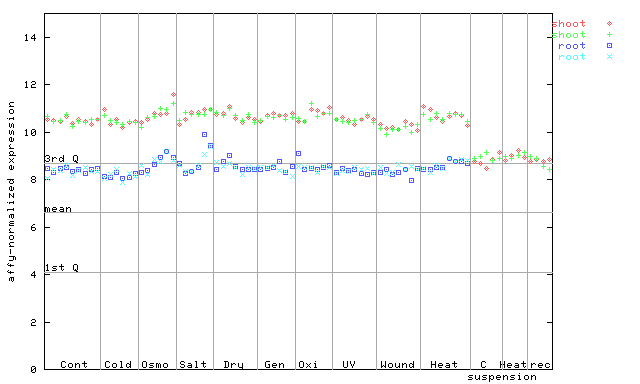
X axis is samples (pdf file), and Y axis is log2-expression. |
|||||||||||||||||||||||||||||||||||||||||||||
| AtGenExpress* (Hormone) |
264641_at
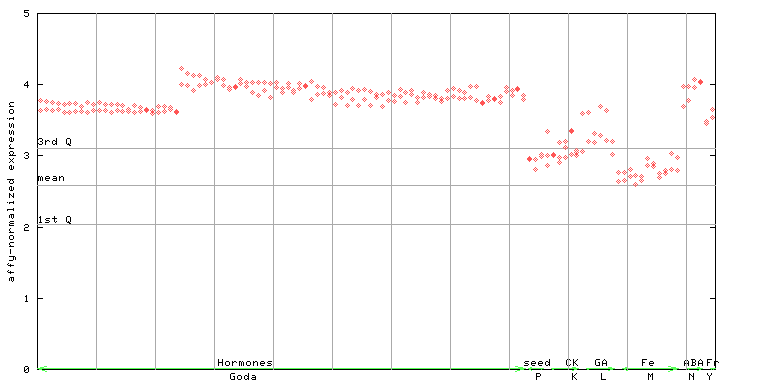
X axis is samples (xls file), and Y axis is log-expression. |
|||||||||||||||||||||||||||||||||||||||||||||


| Link to other DBs | ||
| Entrez Gene ID | 837432 |
|
| Refseq ID (protein) | NP_001031008.1 | |
| NP_001184945.1 | |
|
| NP_563836.1 | |
|
The preparation time of this page was 0.1 [sec].