[←][→] ath
| functional annotation | ||||||||||||||||||||||||||||||||||||||||||||||||||||||
| Function | P-loop containing nucleoside triphosphate hydrolases superfamily protein |


|
||||||||||||||||||||||||||||||||||||||||||||||||||||
| GO BP |
|
|||||||||||||||||||||||||||||||||||||||||||||||||||||
| GO CC |
|
|||||||||||||||||||||||||||||||||||||||||||||||||||||
| GO MF |
|
|||||||||||||||||||||||||||||||||||||||||||||||||||||
| KEGG | ||||||||||||||||||||||||||||||||||||||||||||||||||||||
| Protein | NP_001321305.1 NP_174599.1 NP_849744.1 | |||||||||||||||||||||||||||||||||||||||||||||||||||||
| BLAST | NP_001321305.1 NP_174599.1 NP_849744.1 | |||||||||||||||||||||||||||||||||||||||||||||||||||||
| Orthologous | [Ortholog page] LOC4351767 (osa) LOC25484494 (mtr) LOC100256808 (vvi) LOC100277737 (zma) LOC100817880 (gma) LOC101252870 (sly) LOC103840080 (bra) | |||||||||||||||||||||||||||||||||||||||||||||||||||||
| Subcellular localization wolf |
|
|||||||||||||||||||||||||||||||||||||||||||||||||||||
| Subcellular localization TargetP |
|
|||||||||||||||||||||||||||||||||||||||||||||||||||||
| Gene coexpression | ||||||||||||||||||||||||||||||||||||||||||||||||||||||
| Network*for coexpressed genes |
|
|||||||||||||||||||||||||||||||||||||||||||||||||||||
|---|---|---|---|---|---|---|---|---|---|---|---|---|---|---|---|---|---|---|---|---|---|---|---|---|---|---|---|---|---|---|---|---|---|---|---|---|---|---|---|---|---|---|---|---|---|---|---|---|---|---|---|---|---|---|
| Coexpressed gene list |
[Coexpressed gene list for AT1G33290] | |||||||||||||||||||||||||||||||||||||||||||||||||||||
| Gene expression | ||||||||||||||||||||||||||||||||||||||||||||||||||||||
| All samples | [Expression pattern for all samples] | |||||||||||||||||||||||||||||||||||||||||||||||||||||
| AtGenExpress* (Development) |
256530_at
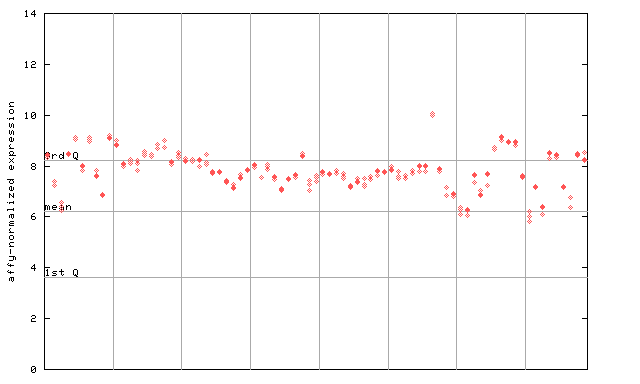
X axis is samples (pdf file), and Y axis is log2-expression. |
|||||||||||||||||||||||||||||||||||||||||||||||||||||
| AtGenExpress* (Stress) |
256530_at
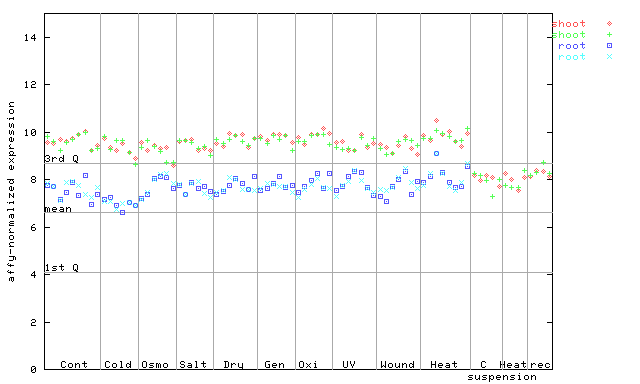
X axis is samples (pdf file), and Y axis is log2-expression. |
|||||||||||||||||||||||||||||||||||||||||||||||||||||
| AtGenExpress* (Hormone) |
256530_at
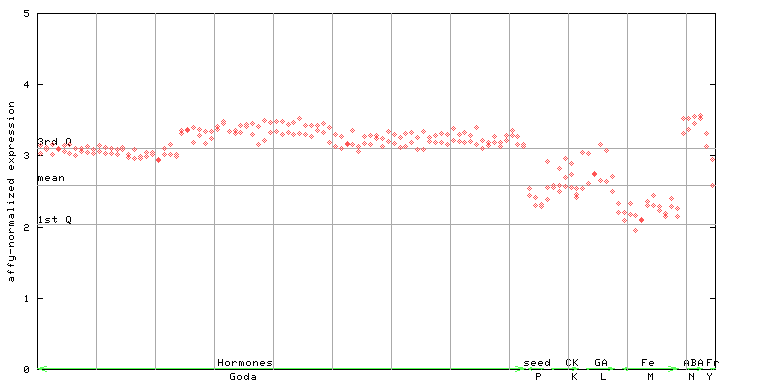
X axis is samples (xls file), and Y axis is log-expression. |
|||||||||||||||||||||||||||||||||||||||||||||||||||||


")
| Link to other DBs | ||
| Entrez Gene ID | 840224 |
|
| Refseq ID (protein) | NP_001321305.1 | |
| NP_174599.1 | |
|
| NP_849744.1 | |
|
The preparation time of this page was 0.2 [sec].