[←][→] ath
| functional annotation | ||||||||||
| Function | methyl esterase 14 |


|
||||||||
| GO BP |
|
|||||||||
| GO CC |
|
|||||||||
| GO MF |
|
|||||||||
| KEGG | ||||||||||
| Protein | NP_174661.1 | |||||||||
| BLAST | NP_174661.1 | |||||||||
| Orthologous | [Ortholog page] MES12 (ath) LOC4344475 (osa) LOC7455270 (ppo) LOC11419391 (mtr) LOC18104301 (ppo) LOC100784567 (gma) LOC100795903 (gma) LOC101243719 (sly) LOC103833611 (bra) LOC103838880 (bra) LOC103840037 (bra) LOC123147608 (tae) LOC123157179 (tae) LOC123165518 (tae) LOC123407604 (hvu) | |||||||||
| Subcellular localization wolf |
|
|||||||||
| Subcellular localization TargetP |
|
|||||||||
| Gene coexpression | ||||||||||
| Network*for coexpressed genes |
||||||||||
|---|---|---|---|---|---|---|---|---|---|---|
| Coexpressed gene list |
[Coexpressed gene list for MES14] | |||||||||
| Gene expression | ||||||||||
| All samples | [Expression pattern for all samples] | |||||||||
| AtGenExpress* (Development) |
255983_at
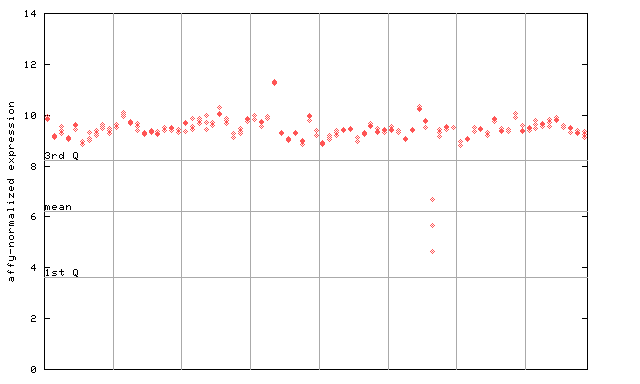
X axis is samples (pdf file), and Y axis is log2-expression. |
|||||||||
| AtGenExpress* (Stress) |
255983_at
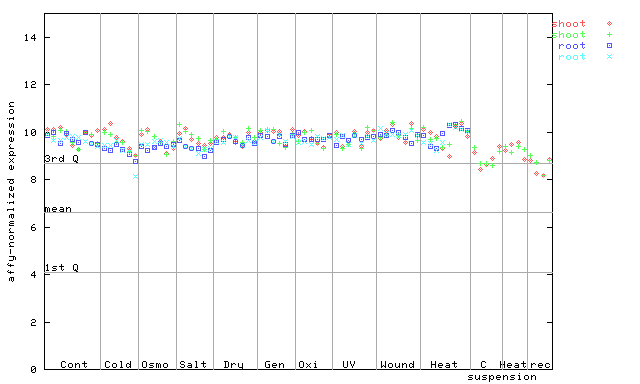
X axis is samples (pdf file), and Y axis is log2-expression. |
|||||||||
| AtGenExpress* (Hormone) |
255983_at
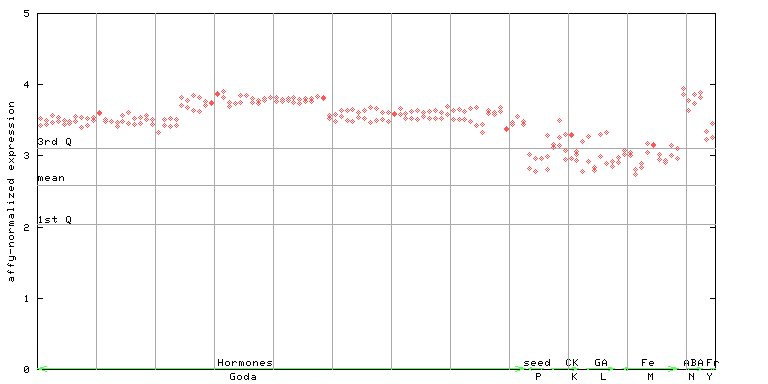
X axis is samples (xls file), and Y axis is log-expression. |
|||||||||


| Link to other DBs | ||
| Entrez Gene ID | 840296 |
|
| Refseq ID (protein) | NP_174661.1 | |
The preparation time of this page was 0.1 [sec].