[←][→] ath
| functional annotation | |||||||||||||||||||||||||||||||||||||||||||||||
| Function | thylakoid lumen 18.3 kDa protein |


|
|||||||||||||||||||||||||||||||||||||||||||||
| GO BP |
|
||||||||||||||||||||||||||||||||||||||||||||||
| GO CC |
|
||||||||||||||||||||||||||||||||||||||||||||||
| GO MF |
|
||||||||||||||||||||||||||||||||||||||||||||||
| KEGG | |||||||||||||||||||||||||||||||||||||||||||||||
| Protein | NP_564667.1 | ||||||||||||||||||||||||||||||||||||||||||||||
| BLAST | NP_564667.1 | ||||||||||||||||||||||||||||||||||||||||||||||
| Orthologous | [Ortholog page] LOC4338729 (osa) LOC7473306 (ppo) LOC11405923 (mtr) LOC18098830 (ppo) LOC100778682 (gma) LOC100813027 (gma) LOC101258104 (sly) LOC103844487 (bra) LOC123055054 (tae) LOC123132131 (tae) LOC123441764 (hvu) | ||||||||||||||||||||||||||||||||||||||||||||||
| Subcellular localization wolf |
|
||||||||||||||||||||||||||||||||||||||||||||||
| Subcellular localization TargetP |
|
||||||||||||||||||||||||||||||||||||||||||||||
| Gene coexpression | |||||||||||||||||||||||||||||||||||||||||||||||
| Network*for coexpressed genes |
|
||||||||||||||||||||||||||||||||||||||||||||||
|---|---|---|---|---|---|---|---|---|---|---|---|---|---|---|---|---|---|---|---|---|---|---|---|---|---|---|---|---|---|---|---|---|---|---|---|---|---|---|---|---|---|---|---|---|---|---|---|
| Coexpressed gene list |
[Coexpressed gene list for TLP18.3] | ||||||||||||||||||||||||||||||||||||||||||||||
| Gene expression | |||||||||||||||||||||||||||||||||||||||||||||||
| All samples | [Expression pattern for all samples] | ||||||||||||||||||||||||||||||||||||||||||||||
| AtGenExpress* (Development) |
264185_at
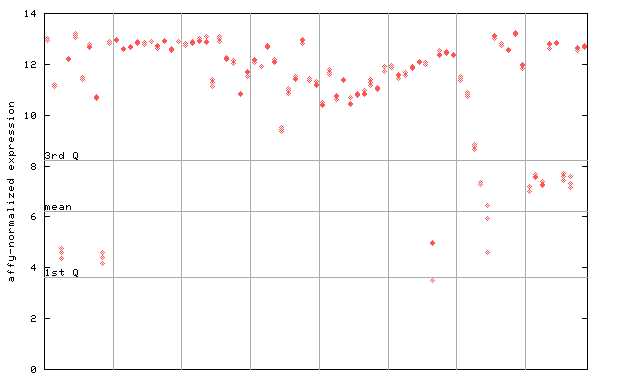
X axis is samples (pdf file), and Y axis is log2-expression. |
||||||||||||||||||||||||||||||||||||||||||||||
| AtGenExpress* (Stress) |
264185_at
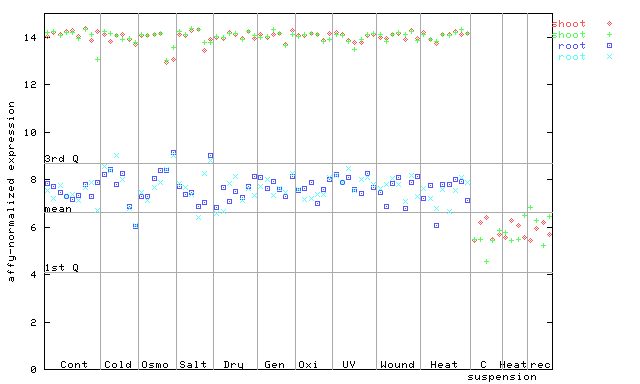
X axis is samples (pdf file), and Y axis is log2-expression. |
||||||||||||||||||||||||||||||||||||||||||||||
| AtGenExpress* (Hormone) |
264185_at
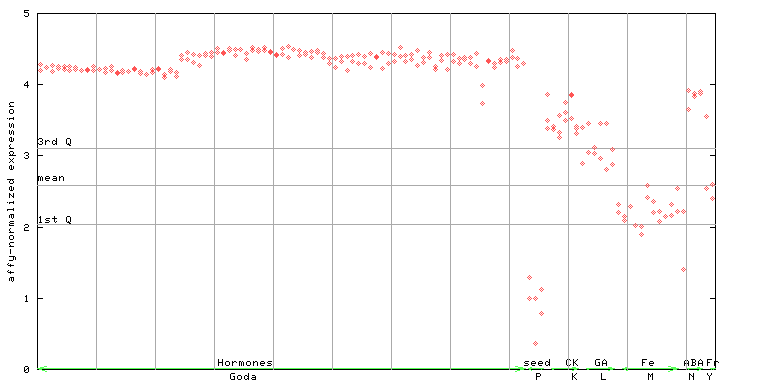
X axis is samples (xls file), and Y axis is log-expression. |
||||||||||||||||||||||||||||||||||||||||||||||


")
")
")
| Link to other DBs | ||
| Entrez Gene ID | 841919 |
|
| Refseq ID (protein) | NP_564667.1 | |
The preparation time of this page was 0.1 [sec].