[←][→] ath
| functional annotation | |||||||||||||||||||||||||||||||
| Function | late embryogenesis abundant domain-containing protein / LEA domain-containing protein |


|
|||||||||||||||||||||||||||||
| GO BP |
|
||||||||||||||||||||||||||||||
| GO CC |
|
||||||||||||||||||||||||||||||
| GO MF |
|
||||||||||||||||||||||||||||||
| KEGG | |||||||||||||||||||||||||||||||
| Protein | NP_177355.1 | ||||||||||||||||||||||||||||||
| BLAST | NP_177355.1 | ||||||||||||||||||||||||||||||
| Orthologous | [Ortholog page] PM27 (gma) AT1G22600 (ath) LOC9266106 (osa) LOC25491788 (mtr) LOC25491790 (mtr) LOC100256187 (vvi) LOC100808861 (gma) LOC101255207 (sly) LOC101264586 (sly) LOC103641657 (zma) LOC103829321 (bra) LOC103852751 (bra) LOC109121966 (vvi) | ||||||||||||||||||||||||||||||
| Subcellular localization wolf |
|
||||||||||||||||||||||||||||||
| Subcellular localization TargetP |
|
||||||||||||||||||||||||||||||
| Gene coexpression | |||||||||||||||||||||||||||||||
| Network*for coexpressed genes |
|
||||||||||||||||||||||||||||||
|---|---|---|---|---|---|---|---|---|---|---|---|---|---|---|---|---|---|---|---|---|---|---|---|---|---|---|---|---|---|---|---|
| Coexpressed gene list |
[Coexpressed gene list for AT1G72100] | ||||||||||||||||||||||||||||||
| Gene expression | |||||||||||||||||||||||||||||||
| All samples | [Expression pattern for all samples] | ||||||||||||||||||||||||||||||
| AtGenExpress* (Development) |
256338_at

X axis is samples (pdf file), and Y axis is log2-expression. |
||||||||||||||||||||||||||||||
| AtGenExpress* (Stress) |
256338_at
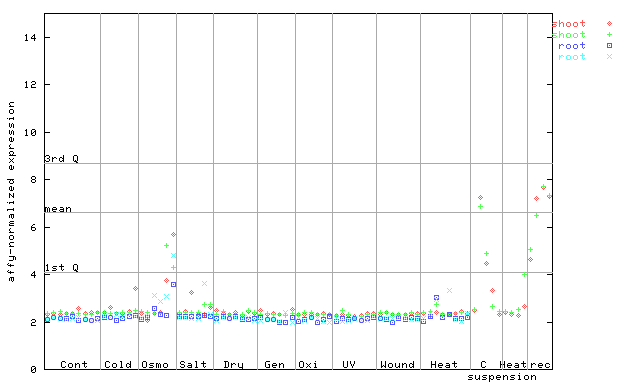
X axis is samples (pdf file), and Y axis is log2-expression. |
||||||||||||||||||||||||||||||
| AtGenExpress* (Hormone) |
256338_at
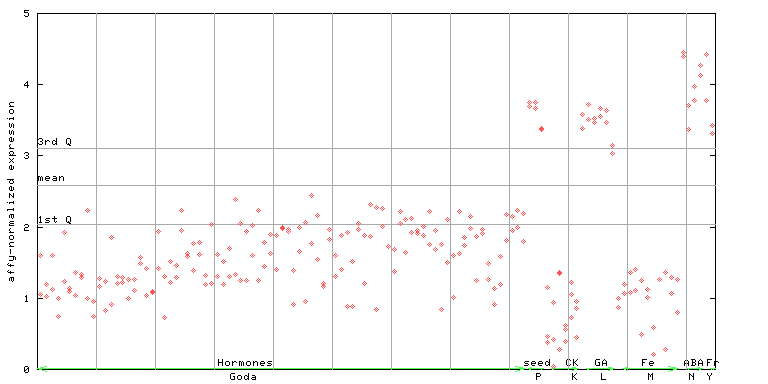
X axis is samples (xls file), and Y axis is log-expression. |
||||||||||||||||||||||||||||||


| Link to other DBs | ||
| Entrez Gene ID | 843541 |
|
| Refseq ID (protein) | NP_177355.1 | |
The preparation time of this page was 0.2 [sec].