[←][→] ath
| functional annotation | |||||||||||||||||||||||||||||||||||||||
| Function | uricase / urate oxidase / nodulin 35 |


|
|||||||||||||||||||||||||||||||||||||
| GO BP |
|
||||||||||||||||||||||||||||||||||||||
| GO CC |
|
||||||||||||||||||||||||||||||||||||||
| GO MF |
|
||||||||||||||||||||||||||||||||||||||
| KEGG | ath00230 [list] [network] Purine metabolism (100 genes) |  |
|||||||||||||||||||||||||||||||||||||
| ath00232 [list] [network] Caffeine metabolism (3 genes) | |
||||||||||||||||||||||||||||||||||||||
| Protein | NP_180191.1 | ||||||||||||||||||||||||||||||||||||||
| BLAST | NP_180191.1 | ||||||||||||||||||||||||||||||||||||||
| Orthologous | [Ortholog page] UR9 (gma) LOC4324793 (osa) LOC7491607 (ppo) LOC25483173 (mtr) UR2 (gma) LOC100037732 (sly) LOC100232988 (vvi) LOC100274529 (zma) LOC103828734 (bra) | ||||||||||||||||||||||||||||||||||||||
| Subcellular localization wolf |
|
||||||||||||||||||||||||||||||||||||||
| Subcellular localization TargetP |
|
||||||||||||||||||||||||||||||||||||||
| Gene coexpression | |||||||||||||||||||||||||||||||||||||||
| Network*for coexpressed genes |
|
||||||||||||||||||||||||||||||||||||||
|---|---|---|---|---|---|---|---|---|---|---|---|---|---|---|---|---|---|---|---|---|---|---|---|---|---|---|---|---|---|---|---|---|---|---|---|---|---|---|---|
| Coexpressed gene list |
[Coexpressed gene list for AT2G26230] | ||||||||||||||||||||||||||||||||||||||
| Gene expression | |||||||||||||||||||||||||||||||||||||||
| All samples | [Expression pattern for all samples] | ||||||||||||||||||||||||||||||||||||||
| AtGenExpress* (Development) |
267374_at
X axis is samples (pdf file), and Y axis is log2-expression. |
||||||||||||||||||||||||||||||||||||||
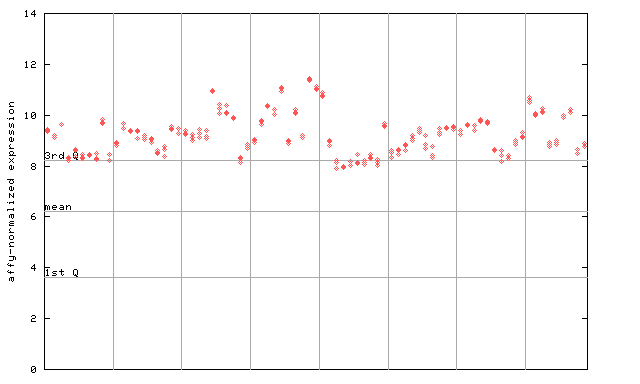
| AtGenExpress* (Stress) |
267374_at
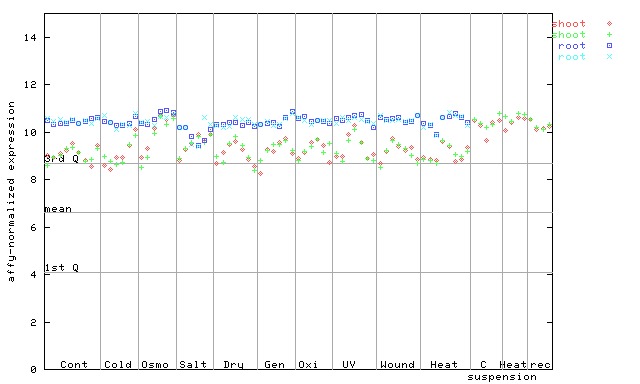
X axis is samples (pdf file), and Y axis is log2-expression. |
||||||||||||||||||||||||||||||||||||||
| AtGenExpress* (Hormone) |
267374_at
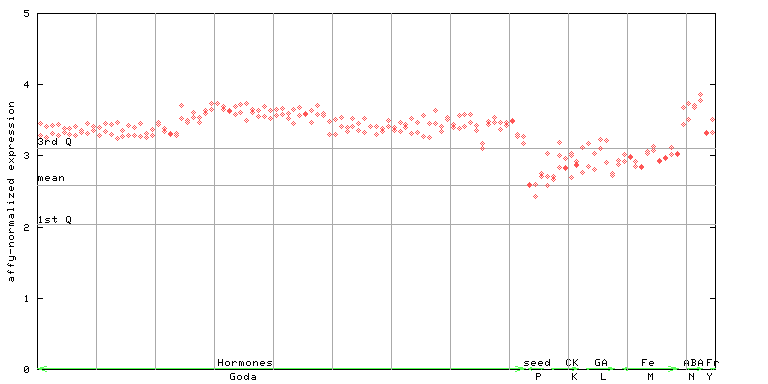
X axis is samples (xls file), and Y axis is log-expression. |
||||||||||||||||||||||||||||||||||||||


")
| Link to other DBs | ||
| Entrez Gene ID | 817163 |
|
| Refseq ID (protein) | NP_180191.1 | |
The preparation time of this page was 0.2 [sec].