[←][→] ath
| functional annotation | |||||||||||||||||||||||||||||||
| Function | S-adenosyl-L-methionine-dependent methyltransferases superfamily protein |


|
|||||||||||||||||||||||||||||
| GO BP |
|
||||||||||||||||||||||||||||||
| GO CC |
|
||||||||||||||||||||||||||||||
| GO MF |
|
||||||||||||||||||||||||||||||
| KEGG | |||||||||||||||||||||||||||||||
| Protein | NP_187161.1 | ||||||||||||||||||||||||||||||
| BLAST | NP_187161.1 | ||||||||||||||||||||||||||||||
| Orthologous | [Ortholog page] LOC4344221 (osa) LOC18098900 (ppo) LOC18110963 (ppo) LOC25491616 (mtr) LOC100787144 (gma) LOC100798127 (gma) LOC101248142 (sly) LOC103859078 (bra) LOC103870856 (bra) LOC103874559 (bra) LOC123043800 (tae) LOC123051655 (tae) LOC123187585 (tae) LOC123429503 (hvu) | ||||||||||||||||||||||||||||||
| Subcellular localization wolf |
|
||||||||||||||||||||||||||||||
| Subcellular localization TargetP |
|
||||||||||||||||||||||||||||||
| Gene coexpression | |||||||||||||||||||||||||||||||
| Network*for coexpressed genes |
|
||||||||||||||||||||||||||||||
|---|---|---|---|---|---|---|---|---|---|---|---|---|---|---|---|---|---|---|---|---|---|---|---|---|---|---|---|---|---|---|---|
| Coexpressed gene list |
[Coexpressed gene list for AT3G05100] | ||||||||||||||||||||||||||||||
| Gene expression | |||||||||||||||||||||||||||||||
| All samples | [Expression pattern for all samples] | ||||||||||||||||||||||||||||||
| AtGenExpress* (Development) |
259300_at
X axis is samples (pdf file), and Y axis is log2-expression. |
||||||||||||||||||||||||||||||
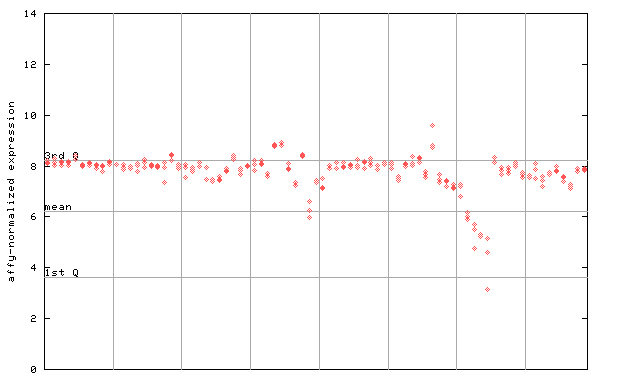
| AtGenExpress* (Stress) |
259300_at
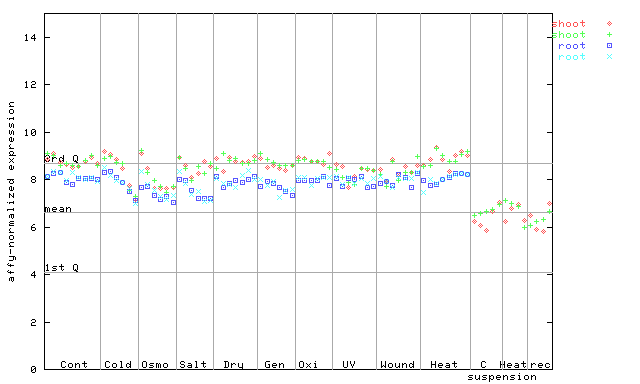
X axis is samples (pdf file), and Y axis is log2-expression. |
||||||||||||||||||||||||||||||
| AtGenExpress* (Hormone) |
259300_at
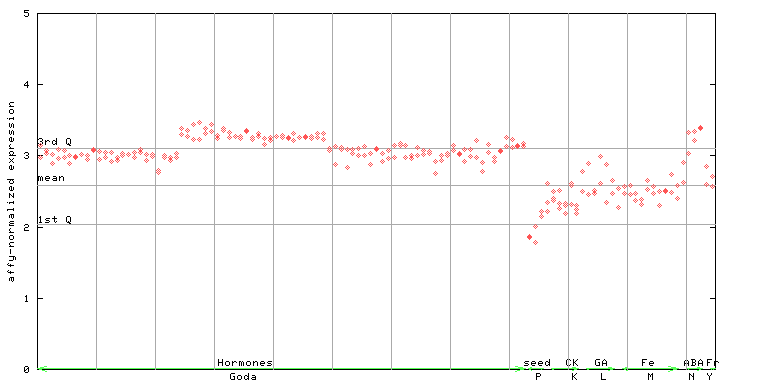
X axis is samples (xls file), and Y axis is log-expression. |
||||||||||||||||||||||||||||||


| Link to other DBs | ||
| Entrez Gene ID | 819672 |
|
| Refseq ID (protein) | NP_187161.1 | |
The preparation time of this page was 0.1 [sec].