[←][→] ath
| functional annotation | ||||||||||||||||||||||||||||||||||
| Function | lycopene cyclase |


|
||||||||||||||||||||||||||||||||
| GO BP |
|
|||||||||||||||||||||||||||||||||
| GO CC |
|
|||||||||||||||||||||||||||||||||
| GO MF |
|
|||||||||||||||||||||||||||||||||
| KEGG | ath00906 [list] [network] Carotenoid biosynthesis (29 genes) |  |
||||||||||||||||||||||||||||||||
| Protein | NP_001078131.1 NP_187634.1 | |||||||||||||||||||||||||||||||||
| BLAST | NP_001078131.1 NP_187634.1 | |||||||||||||||||||||||||||||||||
| Orthologous | [Ortholog page] LCY1 (sly) LOC4328572 (osa) LOC7496096 (ppo) LOC11419142 (mtr) LOC100252133 (vvi) LOC100383002 (zma) LOC100783830 (gma) LOC100810895 (gma) LOC101267662 (sly) LOC103870482 (bra) | |||||||||||||||||||||||||||||||||
| Subcellular localization wolf |
|
|||||||||||||||||||||||||||||||||
| Subcellular localization TargetP |
|
|||||||||||||||||||||||||||||||||
| Gene coexpression | ||||||||||||||||||||||||||||||||||
| Network*for coexpressed genes |
|
|||||||||||||||||||||||||||||||||
|---|---|---|---|---|---|---|---|---|---|---|---|---|---|---|---|---|---|---|---|---|---|---|---|---|---|---|---|---|---|---|---|---|---|---|
| Coexpressed gene list |
[Coexpressed gene list for LYC] | |||||||||||||||||||||||||||||||||
| Gene expression | ||||||||||||||||||||||||||||||||||
| All samples | [Expression pattern for all samples] | |||||||||||||||||||||||||||||||||
| AtGenExpress* (Development) |
259140_at
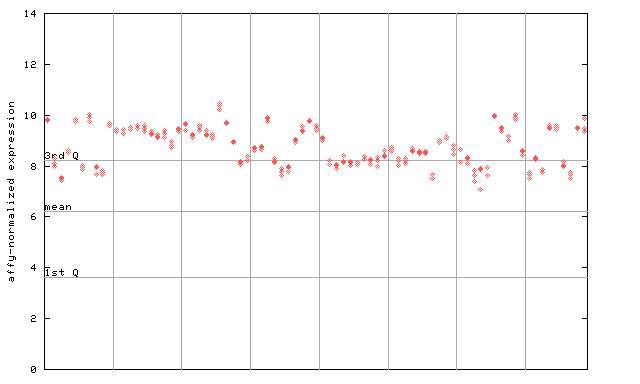
X axis is samples (pdf file), and Y axis is log2-expression. |
|||||||||||||||||||||||||||||||||
| AtGenExpress* (Stress) |
259140_at
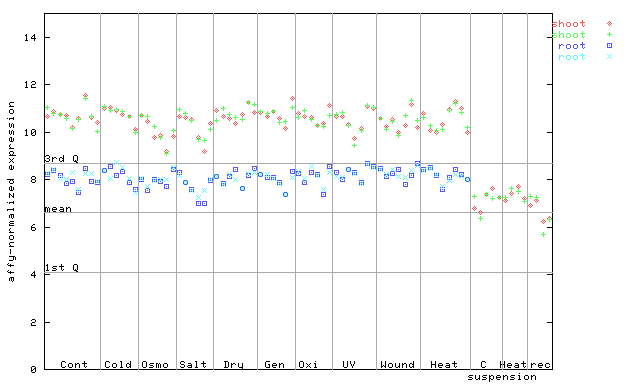
X axis is samples (pdf file), and Y axis is log2-expression. |
|||||||||||||||||||||||||||||||||
| AtGenExpress* (Hormone) |
259140_at
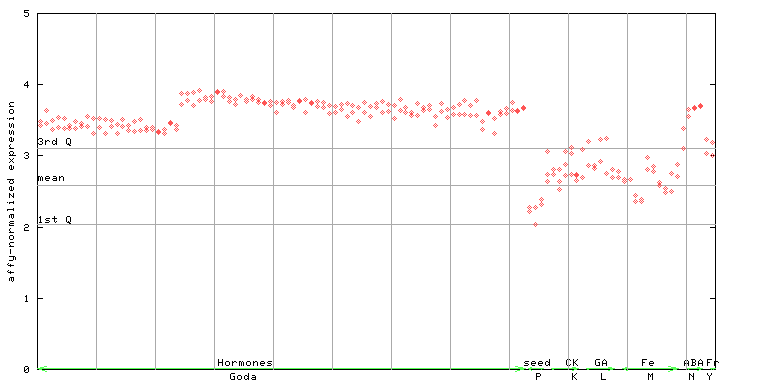
X axis is samples (xls file), and Y axis is log-expression. |
|||||||||||||||||||||||||||||||||


")
| Link to other DBs | ||
| Entrez Gene ID | 820185 |
|
| Refseq ID (protein) | NP_001078131.1 | |
| NP_187634.1 | |
|
The preparation time of this page was 0.2 [sec].