[←][→] ath
| functional annotation | ||||||||||||||||||||||||||||||||||||||||||
| Function | Glycosyl hydrolase superfamily protein |


|
||||||||||||||||||||||||||||||||||||||||
| GO BP |
|
|||||||||||||||||||||||||||||||||||||||||
| GO CC |
|
|||||||||||||||||||||||||||||||||||||||||
| GO MF |
|
|||||||||||||||||||||||||||||||||||||||||
| KEGG | ||||||||||||||||||||||||||||||||||||||||||
| Protein | NP_001328747.1 NP_192013.1 | |||||||||||||||||||||||||||||||||||||||||
| BLAST | NP_001328747.1 NP_192013.1 | |||||||||||||||||||||||||||||||||||||||||
| Orthologous | [Ortholog page] LOC4326620 (osa) LOC7494143 (ppo) LOC11410962 (mtr) LOC100191341 (zma) LOC100779538 (gma) LOC100797233 (gma) LOC101251382 (sly) LOC103647379 (zma) LOC103858830 (bra) LOC104877308 (vvi) | |||||||||||||||||||||||||||||||||||||||||
| Subcellular localization wolf |
|
|||||||||||||||||||||||||||||||||||||||||
| Subcellular localization TargetP |
|
|||||||||||||||||||||||||||||||||||||||||
| Gene coexpression | ||||||||||||||||||||||||||||||||||||||||||
| Network*for coexpressed genes |
|
|||||||||||||||||||||||||||||||||||||||||
|---|---|---|---|---|---|---|---|---|---|---|---|---|---|---|---|---|---|---|---|---|---|---|---|---|---|---|---|---|---|---|---|---|---|---|---|---|---|---|---|---|---|---|
| Coexpressed gene list |
[Coexpressed gene list for AT4G01040] | |||||||||||||||||||||||||||||||||||||||||
| Gene expression | ||||||||||||||||||||||||||||||||||||||||||
| All samples | [Expression pattern for all samples] | |||||||||||||||||||||||||||||||||||||||||
| AtGenExpress* (Development) |
255603_at
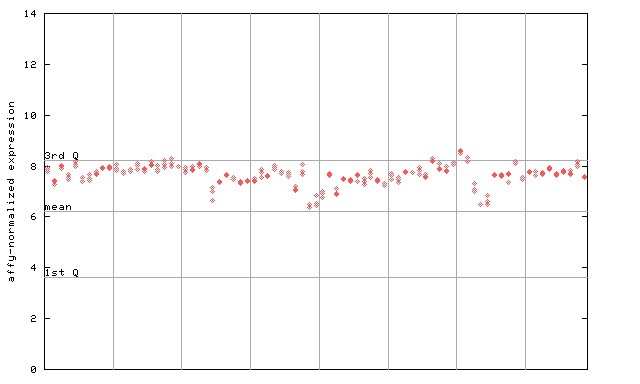
X axis is samples (pdf file), and Y axis is log2-expression. |
|||||||||||||||||||||||||||||||||||||||||
| AtGenExpress* (Stress) |
255603_at
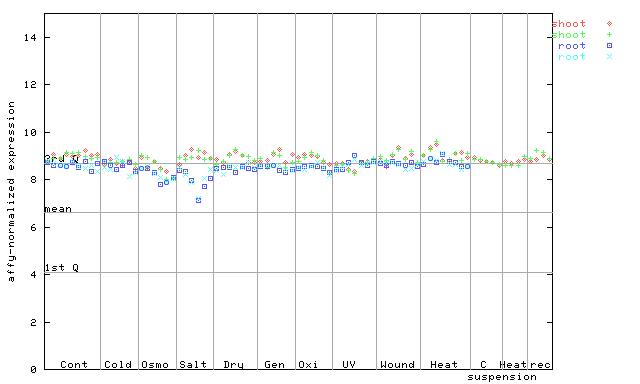
X axis is samples (pdf file), and Y axis is log2-expression. |
|||||||||||||||||||||||||||||||||||||||||
| AtGenExpress* (Hormone) |
255603_at
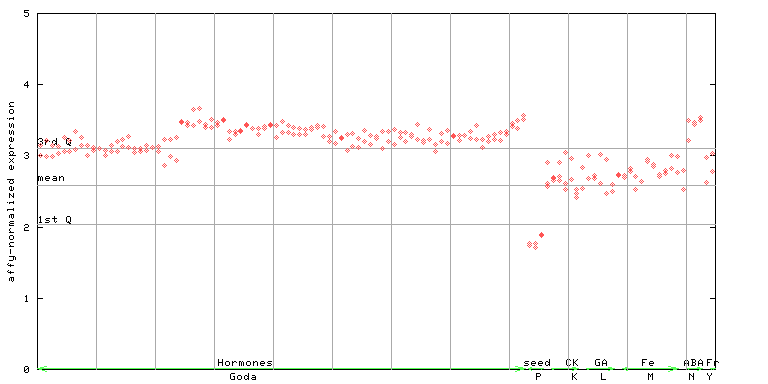
X axis is samples (xls file), and Y axis is log-expression. |
|||||||||||||||||||||||||||||||||||||||||


")
")
")
| Link to other DBs | ||
| Entrez Gene ID | 827924 |
|
| Refseq ID (protein) | NP_001328747.1 | |
| NP_192013.1 | |
|
The preparation time of this page was 0.2 [sec].