[←][→] ath
| functional annotation | ||||||||||||||||||||||||||||||||||||||||||||||||||||||||||||
| Function | MICOS complex subunit |


|
||||||||||||||||||||||||||||||||||||||||||||||||||||||||||
| GO BP |
|
|||||||||||||||||||||||||||||||||||||||||||||||||||||||||||
| GO CC |
|
|||||||||||||||||||||||||||||||||||||||||||||||||||||||||||
| GO MF |
|
|||||||||||||||||||||||||||||||||||||||||||||||||||||||||||
| KEGG | ||||||||||||||||||||||||||||||||||||||||||||||||||||||||||||
| Protein | NP_568066.1 | |||||||||||||||||||||||||||||||||||||||||||||||||||||||||||
| BLAST | NP_568066.1 | |||||||||||||||||||||||||||||||||||||||||||||||||||||||||||
| Orthologous | [Ortholog page] LOC4337144 (osa) LOC7486320 (ppo) LOC7490234 (ppo) LOC11442558 (mtr) LOC100794530 (gma) LOC100807909 (gma) LOC101244573 (sly) LOC103835103 (bra) LOC123047208 (tae) LOC123055010 (tae) LOC123190858 (tae) LOC123428225 (hvu) | |||||||||||||||||||||||||||||||||||||||||||||||||||||||||||
| Subcellular localization wolf |
|
|||||||||||||||||||||||||||||||||||||||||||||||||||||||||||
| Subcellular localization TargetP |
|
|||||||||||||||||||||||||||||||||||||||||||||||||||||||||||
| Gene coexpression | ||||||||||||||||||||||||||||||||||||||||||||||||||||||||||||
| Network*for coexpressed genes |
|
|||||||||||||||||||||||||||||||||||||||||||||||||||||||||||
|---|---|---|---|---|---|---|---|---|---|---|---|---|---|---|---|---|---|---|---|---|---|---|---|---|---|---|---|---|---|---|---|---|---|---|---|---|---|---|---|---|---|---|---|---|---|---|---|---|---|---|---|---|---|---|---|---|---|---|---|---|
| Coexpressed gene list |
[Coexpressed gene list for AT4G39690] | |||||||||||||||||||||||||||||||||||||||||||||||||||||||||||
| Gene expression | ||||||||||||||||||||||||||||||||||||||||||||||||||||||||||||
| All samples | [Expression pattern for all samples] | |||||||||||||||||||||||||||||||||||||||||||||||||||||||||||
| AtGenExpress* (Development) |
252856_at
X axis is samples (pdf file), and Y axis is log2-expression. |
|||||||||||||||||||||||||||||||||||||||||||||||||||||||||||
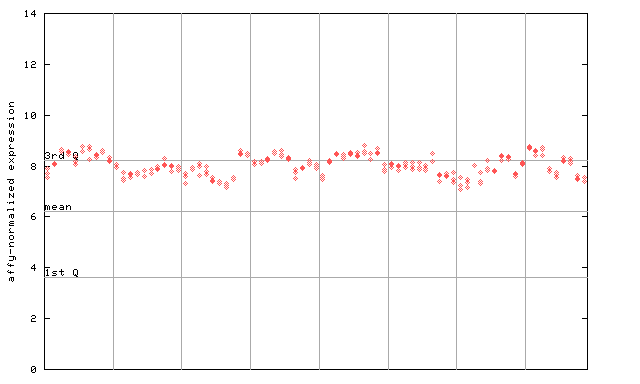
| AtGenExpress* (Stress) |
252856_at
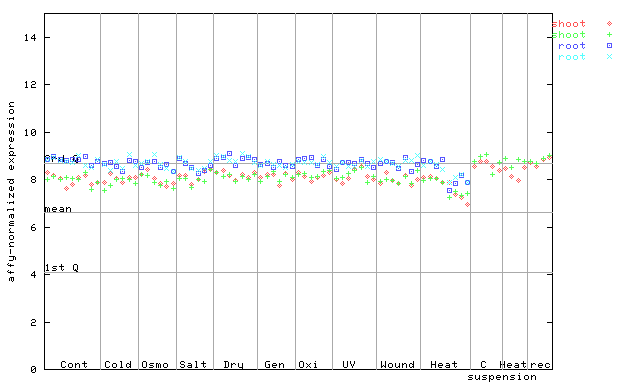
X axis is samples (pdf file), and Y axis is log2-expression. |
|||||||||||||||||||||||||||||||||||||||||||||||||||||||||||
| AtGenExpress* (Hormone) |
252856_at
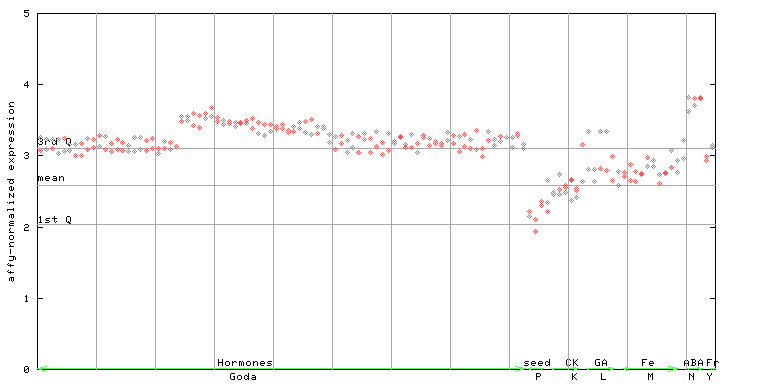
X axis is samples (xls file), and Y axis is log-expression. |
|||||||||||||||||||||||||||||||||||||||||||||||||||||||||||


")
")
")
")
")
| Link to other DBs | ||
| Entrez Gene ID | 830124 |
|
| Refseq ID (protein) | NP_568066.1 | |
The preparation time of this page was 0.1 [sec].