[←][→] ath
| functional annotation | ||||||||||||||||||||||||||||||||||
| Function | plant adhesion molecule 1 |


|
||||||||||||||||||||||||||||||||
| GO BP |
|
|||||||||||||||||||||||||||||||||
| GO CC |
|
|||||||||||||||||||||||||||||||||
| GO MF |
|
|||||||||||||||||||||||||||||||||
| KEGG | ||||||||||||||||||||||||||||||||||
| Protein | NP_197097.1 | |||||||||||||||||||||||||||||||||
| BLAST | NP_197097.1 | |||||||||||||||||||||||||||||||||
| Orthologous | [Ortholog page] AT3G02460 (ath) LOC4345560 (osa) LOC7468375 (ppo) LOC18107430 (ppo) LOC25495518 (mtr) LOC100778662 (gma) LOC100792187 (gma) LOC101262565 (sly) LOC103851015 (bra) LOC103858958 (bra) LOC123087236 (tae) LOC123090723 (tae) LOC123447208 (hvu) | |||||||||||||||||||||||||||||||||
| Subcellular localization wolf |
|
|||||||||||||||||||||||||||||||||
| Subcellular localization TargetP |
|
|||||||||||||||||||||||||||||||||
| Gene coexpression | ||||||||||||||||||||||||||||||||||
| Network*for coexpressed genes |
|
|||||||||||||||||||||||||||||||||
|---|---|---|---|---|---|---|---|---|---|---|---|---|---|---|---|---|---|---|---|---|---|---|---|---|---|---|---|---|---|---|---|---|---|---|
| Coexpressed gene list |
[Coexpressed gene list for PAM1] | |||||||||||||||||||||||||||||||||
| Gene expression | ||||||||||||||||||||||||||||||||||
| All samples | [Expression pattern for all samples] | |||||||||||||||||||||||||||||||||
| AtGenExpress* (Development) |
246482_at
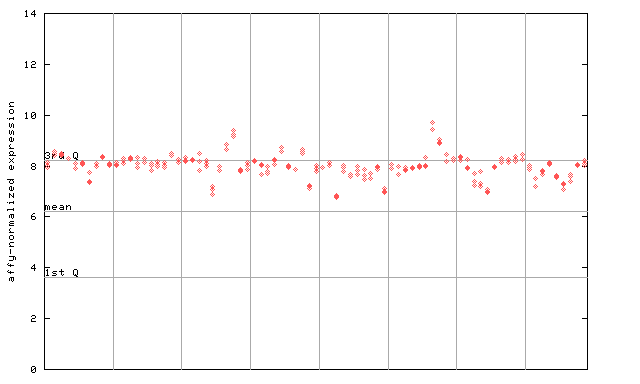
X axis is samples (pdf file), and Y axis is log2-expression. |
|||||||||||||||||||||||||||||||||
| AtGenExpress* (Stress) |
246482_at
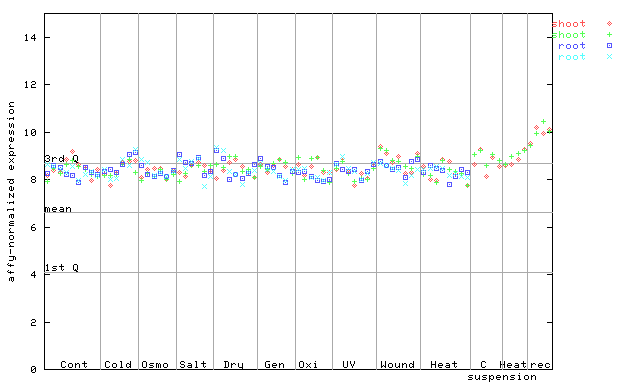
X axis is samples (pdf file), and Y axis is log2-expression. |
|||||||||||||||||||||||||||||||||
| AtGenExpress* (Hormone) |
246482_at
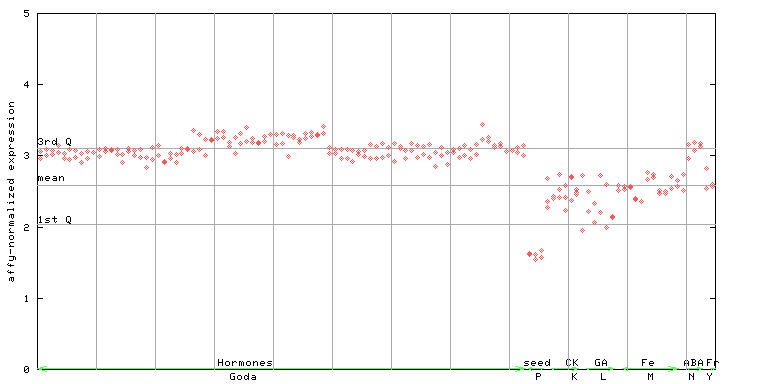
X axis is samples (xls file), and Y axis is log-expression. |
|||||||||||||||||||||||||||||||||


")
| Link to other DBs | ||
| Entrez Gene ID | 831450 |
|
| Refseq ID (protein) | NP_197097.1 | |
The preparation time of this page was 0.1 [sec].