[←][→] ath
| functional annotation | |||||||||||||||||||||||||||||||||||||||||||||||||||||||
| Function | tryptophan synthase beta type 2 |


|
|||||||||||||||||||||||||||||||||||||||||||||||||||||
| GO BP |
|
||||||||||||||||||||||||||||||||||||||||||||||||||||||
| GO CC |
|
||||||||||||||||||||||||||||||||||||||||||||||||||||||
| GO MF |
|
||||||||||||||||||||||||||||||||||||||||||||||||||||||
| KEGG | ath00260 [list] [network] Glycine, serine and threonine metabolism (70 genes) |  |
|||||||||||||||||||||||||||||||||||||||||||||||||||||
| ath00400 [list] [network] Phenylalanine, tyrosine and tryptophan biosynthesis (56 genes) | |
||||||||||||||||||||||||||||||||||||||||||||||||||||||
| ath01230 [list] [network] Biosynthesis of amino acids (251 genes) | |
||||||||||||||||||||||||||||||||||||||||||||||||||||||
| Protein | NP_198669.1 | ||||||||||||||||||||||||||||||||||||||||||||||||||||||
| BLAST | NP_198669.1 | ||||||||||||||||||||||||||||||||||||||||||||||||||||||
| Orthologous | [Ortholog page] LOC4341584 (osa) LOC25495527 (mtr) LOC100261704 (vvi) LOC100802258 (gma) LOC101261400 (sly) LOC103850119 (bra) LOC103863791 (bra) LOC103864163 (bra) LOC109623449 (zma) | ||||||||||||||||||||||||||||||||||||||||||||||||||||||
| Subcellular localization wolf |
|
||||||||||||||||||||||||||||||||||||||||||||||||||||||
| Subcellular localization TargetP |
|
||||||||||||||||||||||||||||||||||||||||||||||||||||||
| Gene coexpression | |||||||||||||||||||||||||||||||||||||||||||||||||||||||
| Network*for coexpressed genes |
|
||||||||||||||||||||||||||||||||||||||||||||||||||||||
|---|---|---|---|---|---|---|---|---|---|---|---|---|---|---|---|---|---|---|---|---|---|---|---|---|---|---|---|---|---|---|---|---|---|---|---|---|---|---|---|---|---|---|---|---|---|---|---|---|---|---|---|---|---|---|---|
| Coexpressed gene list |
[Coexpressed gene list for TSBtype2] | ||||||||||||||||||||||||||||||||||||||||||||||||||||||
| Gene expression | |||||||||||||||||||||||||||||||||||||||||||||||||||||||
| All samples | [Expression pattern for all samples] | ||||||||||||||||||||||||||||||||||||||||||||||||||||||
| AtGenExpress* (Development) |
249515_at
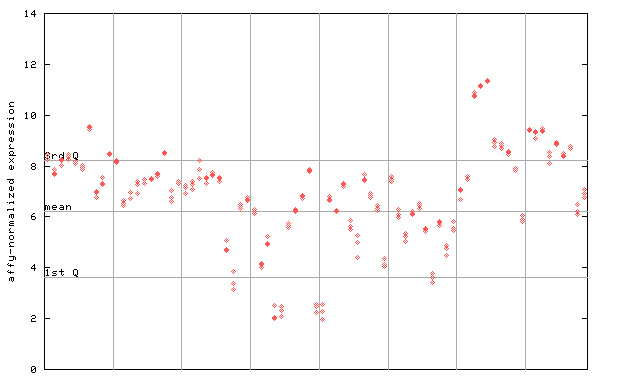
X axis is samples (pdf file), and Y axis is log2-expression. |
||||||||||||||||||||||||||||||||||||||||||||||||||||||
| AtGenExpress* (Stress) |
249515_at
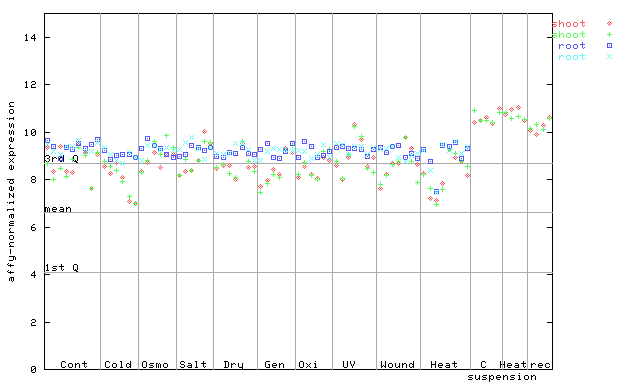
X axis is samples (pdf file), and Y axis is log2-expression. |
||||||||||||||||||||||||||||||||||||||||||||||||||||||
| AtGenExpress* (Hormone) |
249515_at
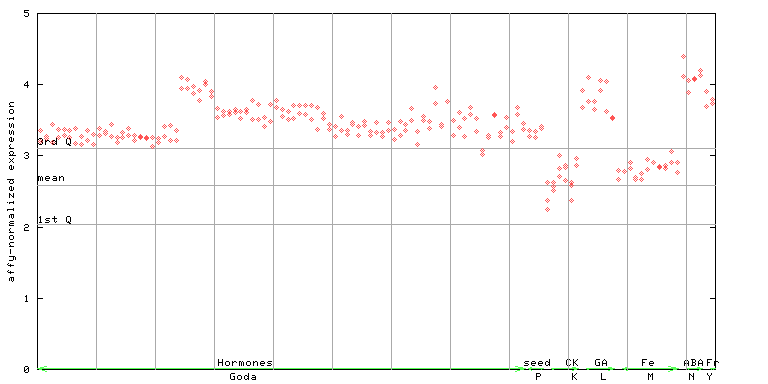
X axis is samples (xls file), and Y axis is log-expression. |
||||||||||||||||||||||||||||||||||||||||||||||||||||||


")
")
")
")
")
| Link to other DBs | ||
| Entrez Gene ID | 833841 |
|
| Refseq ID (protein) | NP_198669.1 | |
The preparation time of this page was 0.3 [sec].