[←][→] ath
| functional annotation | ||||||||||||||||||||||||||||||||||||||||||||
| Function | NADH-ubiquinone oxidoreductase-like protein |


|
||||||||||||||||||||||||||||||||||||||||||
| GO BP |
|
|||||||||||||||||||||||||||||||||||||||||||
| GO CC |
|
|||||||||||||||||||||||||||||||||||||||||||
| GO MF |
|
|||||||||||||||||||||||||||||||||||||||||||
| KEGG | ath00190 [list] [network] Oxidative phosphorylation (142 genes) |  |
||||||||||||||||||||||||||||||||||||||||||
| Protein | NP_201560.1 | |||||||||||||||||||||||||||||||||||||||||||
| BLAST | NP_201560.1 | |||||||||||||||||||||||||||||||||||||||||||
| Orthologous | [Ortholog page] LOC4343746 (osa) LOC7465563 (ppo) LOC7493604 (ppo) LOC11410447 (mtr) LOC100193844 (zma) LOC100245052 (vvi) LOC100250742 (vvi) LOC100281028 (zma) LOC100306371 (gma) LOC100526873 (gma) LOC100852788 (vvi) LOC101264166 (sly) LOC103874037 (bra) | |||||||||||||||||||||||||||||||||||||||||||
| Subcellular localization wolf |
|
|||||||||||||||||||||||||||||||||||||||||||
| Subcellular localization TargetP |
|
|||||||||||||||||||||||||||||||||||||||||||
| Gene coexpression | ||||||||||||||||||||||||||||||||||||||||||||
| Network*for coexpressed genes |
|
|||||||||||||||||||||||||||||||||||||||||||
|---|---|---|---|---|---|---|---|---|---|---|---|---|---|---|---|---|---|---|---|---|---|---|---|---|---|---|---|---|---|---|---|---|---|---|---|---|---|---|---|---|---|---|---|---|
| Coexpressed gene list |
[Coexpressed gene list for FRO1] | |||||||||||||||||||||||||||||||||||||||||||
| Gene expression | ||||||||||||||||||||||||||||||||||||||||||||
| All samples | [Expression pattern for all samples] | |||||||||||||||||||||||||||||||||||||||||||
| AtGenExpress* (Development) |
247011_at
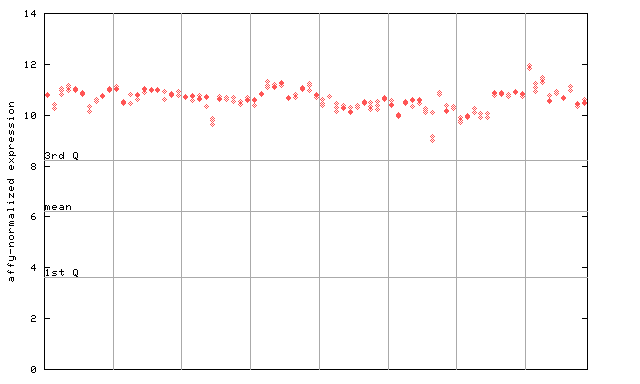
X axis is samples (pdf file), and Y axis is log2-expression. |
|||||||||||||||||||||||||||||||||||||||||||
| AtGenExpress* (Stress) |
247011_at
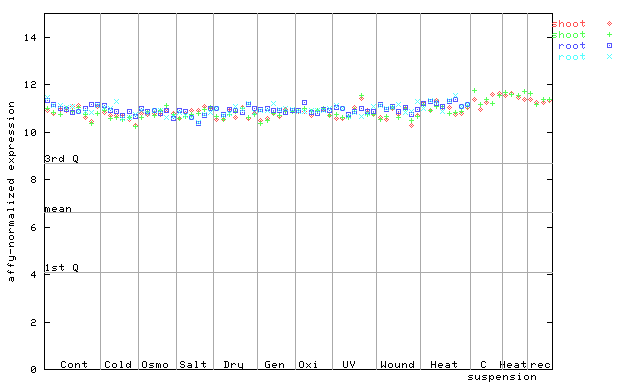
X axis is samples (pdf file), and Y axis is log2-expression. |
|||||||||||||||||||||||||||||||||||||||||||
| AtGenExpress* (Hormone) |
247011_at
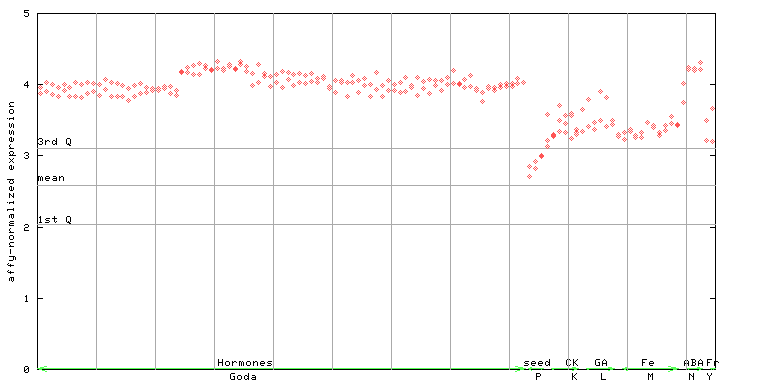
X axis is samples (xls file), and Y axis is log-expression. |
|||||||||||||||||||||||||||||||||||||||||||


")
| Link to other DBs | ||
| Entrez Gene ID | 836895 |
|
| Refseq ID (protein) | NP_201560.1 | |
The preparation time of this page was 0.2 [sec].