[←][→] ath
| functional annotation | |||||||||||||||||||||||||||||||
| Function | non-specific phospholipase C1 |


|
|||||||||||||||||||||||||||||
| GO BP |
|
||||||||||||||||||||||||||||||
| GO CC |
|
||||||||||||||||||||||||||||||
| GO MF |
|
||||||||||||||||||||||||||||||
| KEGG | ath00562 [list] [network] Inositol phosphate metabolism (79 genes) |  |
|||||||||||||||||||||||||||||
| ath00564 [list] [network] Glycerophospholipid metabolism (99 genes) | |
||||||||||||||||||||||||||||||
| ath00565 [list] [network] Ether lipid metabolism (26 genes) | |
||||||||||||||||||||||||||||||
| Protein | NP_172203.2 | ||||||||||||||||||||||||||||||
| BLAST | NP_172203.2 | ||||||||||||||||||||||||||||||
| Orthologous | [Ortholog page] LOC4334641 (osa) LOC7478536 (ppo) LOC25490867 (mtr) LOC100796378 (gma) LOC100813744 (gma) LOC101244700 (sly) LOC103843966 (bra) LOC123087843 (tae) LOC123105751 (tae) LOC123114074 (tae) LOC123123572 (tae) LOC123453130 (hvu) | ||||||||||||||||||||||||||||||
| Subcellular localization wolf |
|
||||||||||||||||||||||||||||||
| Subcellular localization TargetP |
|
||||||||||||||||||||||||||||||
| Gene coexpression | |||||||||||||||||||||||||||||||
| Network*for coexpressed genes |
|
||||||||||||||||||||||||||||||
|---|---|---|---|---|---|---|---|---|---|---|---|---|---|---|---|---|---|---|---|---|---|---|---|---|---|---|---|---|---|---|---|
| Coexpressed gene list |
[Coexpressed gene list for NPC1] | ||||||||||||||||||||||||||||||
| Gene expression | |||||||||||||||||||||||||||||||
| All samples | [Expression pattern for all samples] | ||||||||||||||||||||||||||||||
| AtGenExpress* (Development) |
256041_at
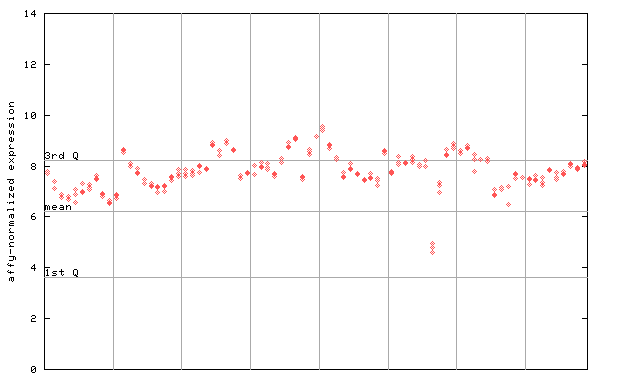
X axis is samples (pdf file), and Y axis is log2-expression. |
||||||||||||||||||||||||||||||
| AtGenExpress* (Stress) |
256041_at
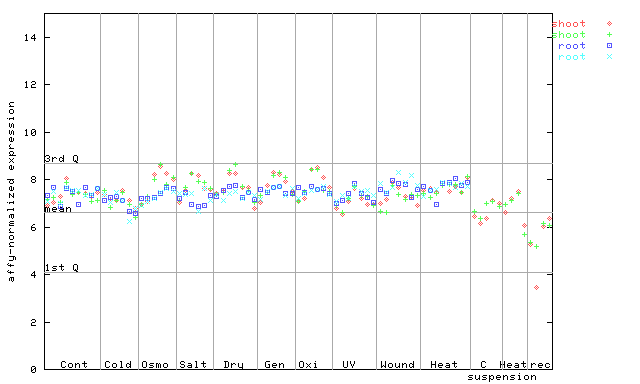
X axis is samples (pdf file), and Y axis is log2-expression. |
||||||||||||||||||||||||||||||
| AtGenExpress* (Hormone) |
256041_at
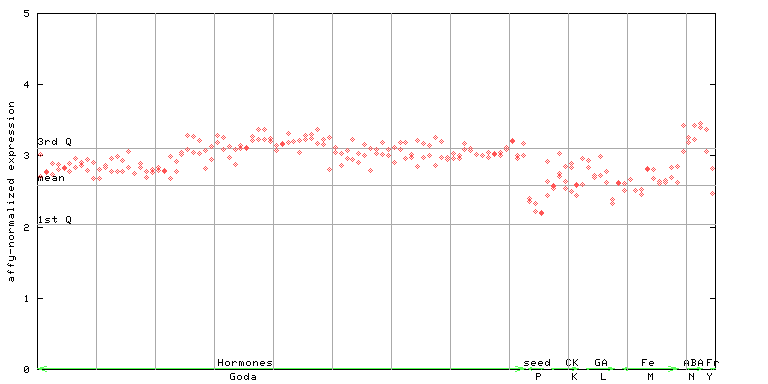
X axis is samples (xls file), and Y axis is log-expression. |
||||||||||||||||||||||||||||||


| Link to other DBs | ||
| Entrez Gene ID | 837234 |
|
| Refseq ID (protein) | NP_172203.2 | |
The preparation time of this page was 0.1 [sec].