[←][→] ath
| functional annotation | ||||||
| Function | RING-H2 finger A1B |


|
||||
| GO BP |
|
|||||
| GO CC |
|
|||||
| GO MF |
|
|||||
| KEGG | ||||||
| Protein | NP_192875.1 | |||||
| BLAST | NP_192875.1 | |||||
| Orthologous | [Ortholog page] RHA1A (ath) LOC103833876 (bra) LOC103858600 (bra) | |||||
| Subcellular localization wolf |
|
|||||
| Subcellular localization TargetP |
|
|||||
| Gene coexpression | ||||||
| Network*for coexpressed genes |
||||||
|---|---|---|---|---|---|---|
| Coexpressed gene list |
[Coexpressed gene list for RHA1B] | |||||
| Gene expression | ||||||
| All samples | [Expression pattern for all samples] | |||||
| AtGenExpress* (Development) |
254919_at
X axis is samples (pdf file), and Y axis is log2-expression. |
|||||
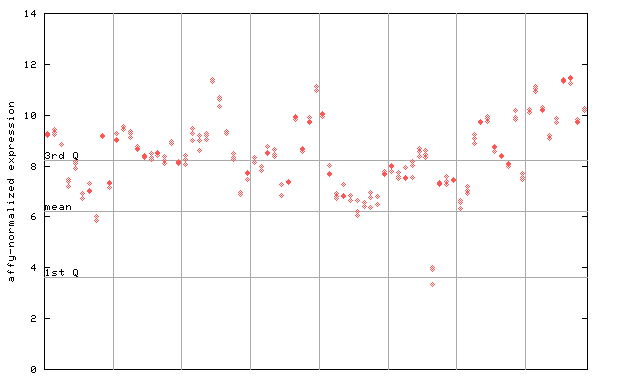
| AtGenExpress* (Stress) |
254919_at
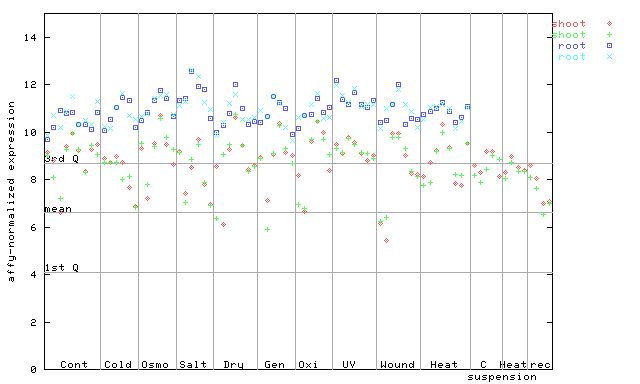
X axis is samples (pdf file), and Y axis is log2-expression. |
|||||
| AtGenExpress* (Hormone) |
254919_at
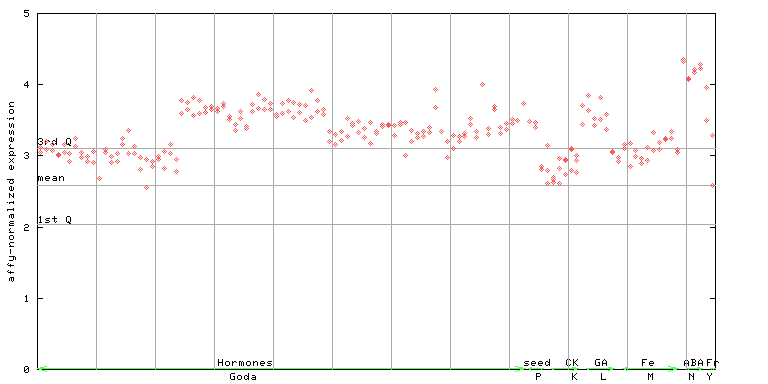
X axis is samples (xls file), and Y axis is log-expression. |
|||||


| Link to other DBs | ||
| Entrez Gene ID | 826738 |
|
| Refseq ID (protein) | NP_192875.1 | |
The preparation time of this page was 0.1 [sec].