These are several methods for comprehensive cis element prediction. For example,
- Searching the genome using experimentally reported cis elements. (e.g. AGRIS and AthaMap)
- Extracting conserved motifs from defined gene groups using co-expressed genes or gene annotation.
- Searching oligomers that are correlated with gene expression.
We used the 3rd method for cis element prediction in ATTED-II, namely searching oligomers that are correlated with gene expression.
To estimate significance of a cis element candidate to function as a
bone fide cis element, CEG value is defined as the correlation between cis element appearance
AP and relative expression of genes
RE.
cis element appearance
AP is a binary value defined for each
cis element candidate c, each
position from TSS p and each
gene g.

REg,s is the relative expression of gene g in sample s compared with its control sample.
The CEG value is the Pearson's correlation coefficient between APc,p,g and REg,s.
, where  ,
,  , and G is the number of genes.
As an example, CEG value is estimated under the following conditions:
- Cis element candidate c; "AACCCTA"
- Array sample s; cytokinin treatment
- Position p; 41 and 141 bp upstream of the TSS.
Figure A is the image of cis element appearance (APc="AACCCTA",p=41,g). The AP of genes with AACCCTA in [1, 81] region upstream of TSS is set as 1, otherwise as 0.
On the scatter plot of Figure B, all genes on microarray were plotted. The y-axis is APc,p,g and the x-axis is gene expression changes (REg,s) in base-10 logarithm in response to cytokinin (CK) treatment.
The CEG value is the Pearson's correlation coefficient of this plot, which is 0.09.
Figure C is the same plot as Figure B, but for a different position p (p = 141). In this case, the CEG value is 0.00.

In the same way, CEG values were calculated for each cis element candidate, each position and each GeneChip sample.
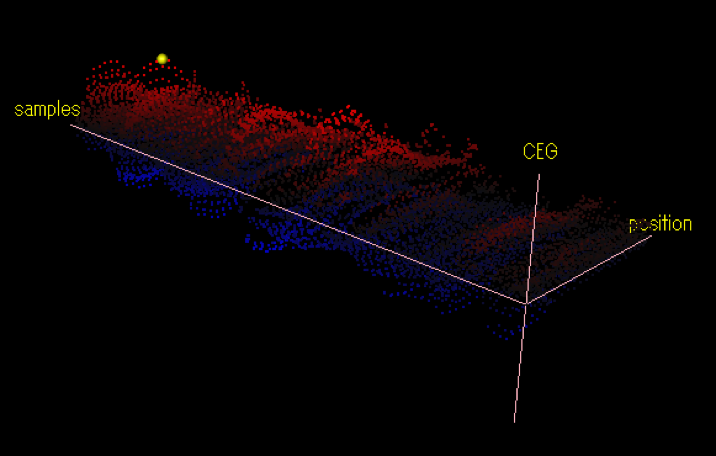
This is the result of the CEG calculation for a cis element candidate, AGGCCCA.
The CEG values were calculated for 771 array samples and for all position between -200 and the TSS. In some array samples, CEG values are positives (represented by red dots), and in some other samples, they are negatives (represented by blue dots).
The yellow point has the maximum distance from the 'zero' plane. It means this cis-element candidate is the most effective at the array sample and the position.
In the next section, the CEG value of the yellow dot (
) is compared with those of the other cis elements candidates.

This figure shows the comparison of the maximum CEG values between all cis element candidates.
The y-axis is the maximum CEG values for each cis element candidate
c (
).
Its distribution is overlaid on the y-axis.
The x-axis is all the cis element candidates (all possible heptamers, 4
7 = 16384).
For ATTED-II, we selected the 304 heptamers having a maximum CEG value larger than 0.06 as cis elements.
[List of 304 cis elements]