To estimate gene regulatory schemes, cis-elements in regions 200-bp upstream of TSS were predicted by our original method (Obayashi et al., in preparation). Briefly, we estimated activities of cis-element candidates designed as heptamers by PCC calculation between gene expression changes and presence of the cis-element candidates in the gene promoter with 80-bp windows. We named the calculated PCC as cis-element activity, CEG (correlation between expression and a defined group of genes) value (see next section for detailed description). As a result, 304 heptamer cis-elements were extracted, which form 4 major groups (Pattern I to IV) with respect to position specificities of the presence and the activities (Figure below).

The 82 cis-elements of Pattern I are preferably located near TSS. This group contains 23 TATA-box-related heptamers, which are present in 26% of the genes. The highest activity is observed when the first T appears at -33, agreeing well with a previous report (29%, at -32) (
Molina and Grotewold, 2005). Information of TSS used in this calculation was downloaded from
TAIR.
Jackknife cross-validated CEG values were also calculated for each gene. Some of the results were experimentally validated in previous reports. For example, a TATA-box and an ACE-box were detected in chalcone synthase gene (
At5g13930) at an appropriate position, and the ACE-box was shown to function as a cis-element for that gene (
Schindler et al., 1992).
For listing candidates of a TF to bind to a cis-element, we searched TFs whose expression profiles are correlated with the CEG profile of the cis-element. For example, the computed list of TFs for a G-box related sequence, CACGTGT, contains the G-box binding factor 3 (GBF3,
At2g46270) (
Hartmann et al., 1998), supporting that the computed list of TFs can successfully identify possible TF(s) binding to specific cis-element. Lists of all TFs in Arabidopsis were downloaded from
AGRIS.
For the extraction of cis element, we calculated the correlation between expression and cis element existence. All 7mer (16384 sequences from AAAAAAA to TTTTTTT) was used as cis element candidates. For each candidate, the degree for relation between the existence of the cis element candidate and gene expression was calculated.
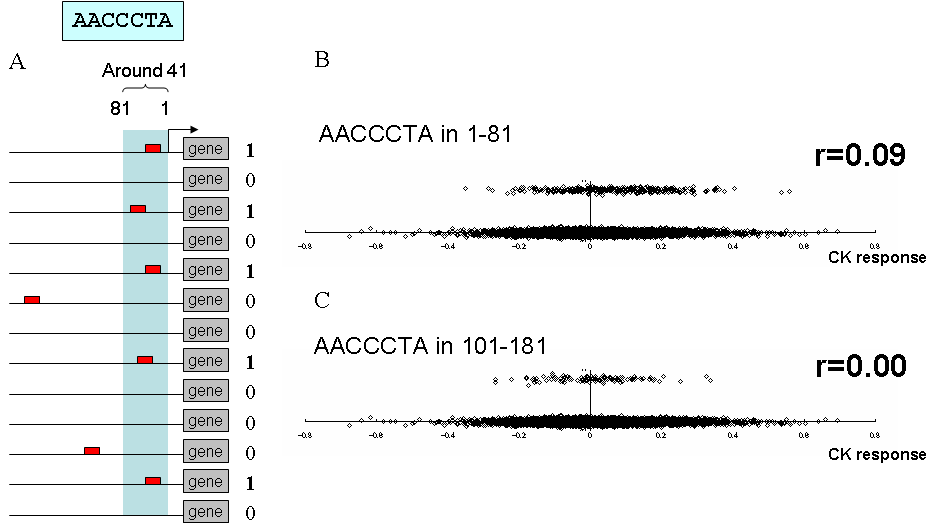
Figure below shows the examples of the calculation for a cis element candidate, AACCCTA, for cytokinin response. When this cis element candidate, AACCCTA, is observed in the upstream region from 1 to 81 in a gene, the gene is plotted on y-axis as 1, otherwise 0 (Fig. A).
On x-axis, log-transformed intensity of cytokinin response was plotted for all genes. Namely up-regulated genes were plotted on right side and down-regulated genes were plotted on left side. In the figure B, the larger number of genes with AACCCTA is induced by cytokinin than genes without AACCCTA. On the other hand, genes with AACCCTA in the region from 101 to 181 shows same distribution of genes without AACCCTA in this region, suggesting AACCCTA in this region is meaningless for cytokinin response (Fig. C).
Point biserial correlation coefficients were used for representation of this population bias between induced and repressed genes. The first example gives 0.09, and the next example gives 0.00. We call this correlation coefficients CEG value. It is calculated for all cis element candidates for all samples and for several positions with 80-bp windows.


