The prediction of the transcription factor (TF) binding a cis element is based on the correlation between the CEG profile of a cis element and the gene expression profile of TF.
Figure 1 is the CEG profile of "CACGTGT". The 771 array samples are given on the x-axis. The y-axis is the CEG values at the most efficient position
CEG (c="CACGTGT", s, p=(the most effective position)).
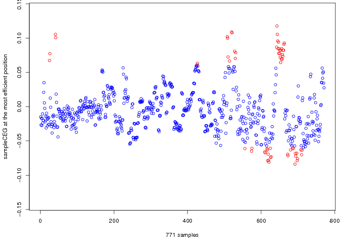
Figure 1 |
Figure 2 is the expression profile of a TF, GBF3. The 771 array samples are given on the x-axis. The y-axis is the normalized relative expression to average level of this gene.
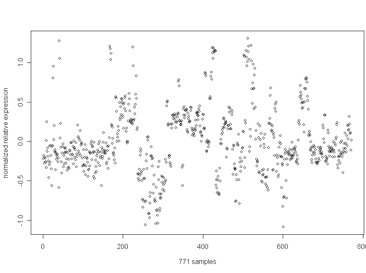
Figure 2 |
Both profiles for cis element and TF include 771 array samples.
On the figure below, 771 samples are plotted.
The x-axis is the CEG value for CACGTGT, and the y-axis is the relative gene expression of GBF3.
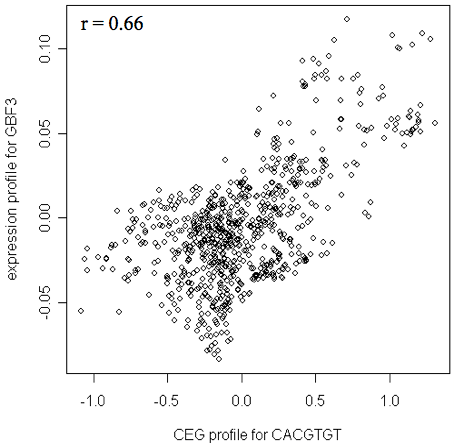
When this TF's expression level increases, the CEG value of this cis element candidate also increases. The Pearson's correlation coefficient is 0.66.
In cis element page, TFs with a Pearson's correlation coefficient against the cis element higher than 0.5 or lower than -0.5 are listed.
A positive correlation suggests an activator, while a negative correlation suggests a repressor.
List of predicted TFs whose mRNA profiles are correlated (|r| > 0.5) with CEG profile of CACGTGT.
| Correl | TF | Function*((alias)) |
|---|
| 0.71 | At4g27410 | no apical meristem (NAM) family protein (RD26) ((RD26))
|
| 0.67 | At1g01720 | no apical meristem (NAM) family protein ((ATAF1))
|
| 0.66 | At2g46270 | G-box binding factor 3 (GBF3) ((GBF3))
|
| 0.62 | At5g12840 | CCAAT-binding transcription factor (CBF-B/NF-YA) family protein ((HAP2A))
|
| 0.60 | At1g77450 | no apical meristem (NAM) family protein
|
| ... | ... | ...
|
[
Link to cis element page of CACGTGT]