last update; Jun. 18. 2020
Although strength of coexpression is represented by
MR value, the coexpression may be artifact in a platform. A measure,
supportability, is introduced to quantify reproducibility of a coexpressed gene list of interest.
History on ATTED-II
The
supportability is previously called as
reliability.
With the refinement at Sep 2015, we renamed the
reliability to
supportability for the following two reasons.
- We are trying to evaluate quality of coexpression data from various aspects. Reliability is not suitable to mean one of such measures.
- Coexpression supported by another platform is reliable, but the converse is not true. Namely, coexpression without any supports can be occured when appropriate reference is not available.
| Period |
Term |
Calculation of coex list similarity |
Null distribution |
Threshold |
| ☆ |
☆☆ |
☆☆☆ |
| 2013-08 ~ 2015-08 |
Reliability |
COXSIM(100) |
Common for all platform virtually including 10000 genes |
E-04 |
E-12 |
E-20 |
| 2015-09 ~ now |
Supportability |
COXSIM(1%) |
Enpirical COXSIM distributions between an Arabidopsis (Ath-r) gene and a rice (Osa-r) gene irrespective of gene homology. |
E-01 |
E-02 |
E-03 |
When a gene list is repeatedly observed in indipendent platforms, the coexpressed gene list can be regarded as reliable.
- Example of well-supported coexpressed gene list: DHCR7 (Hsa)
- Example of less-supported coexpressed gene list: CCND3 (Hsa)
There are two possible ways to compare coexpression for reliability assessment. One is comparison of gene pairs (A), and the other is comparison of gene lists (B).
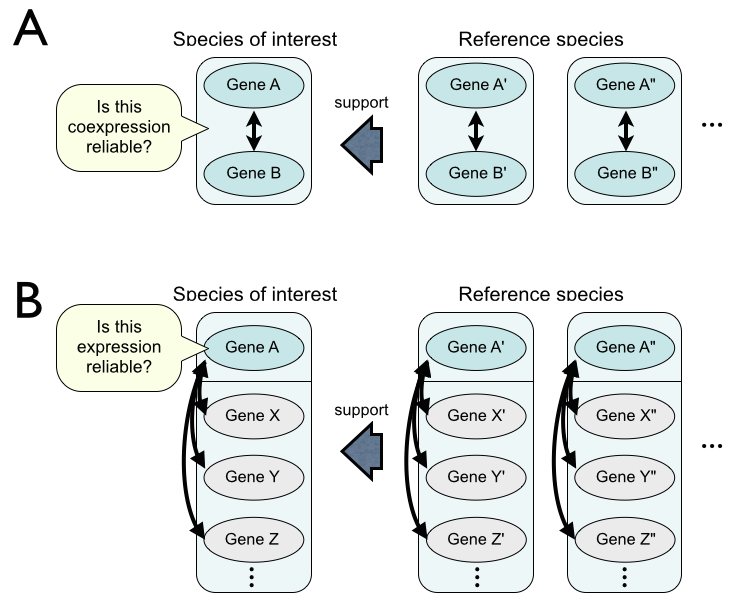
We employ the B-type (gene list) comparison because pseudo coexpression is mainly caused by inappropriate probes with weak hybridization or cross-hybridization and thus pseudo coexpression appears not only one gene pair but also all gene pairs from the problematic guide gene.
Basic idea
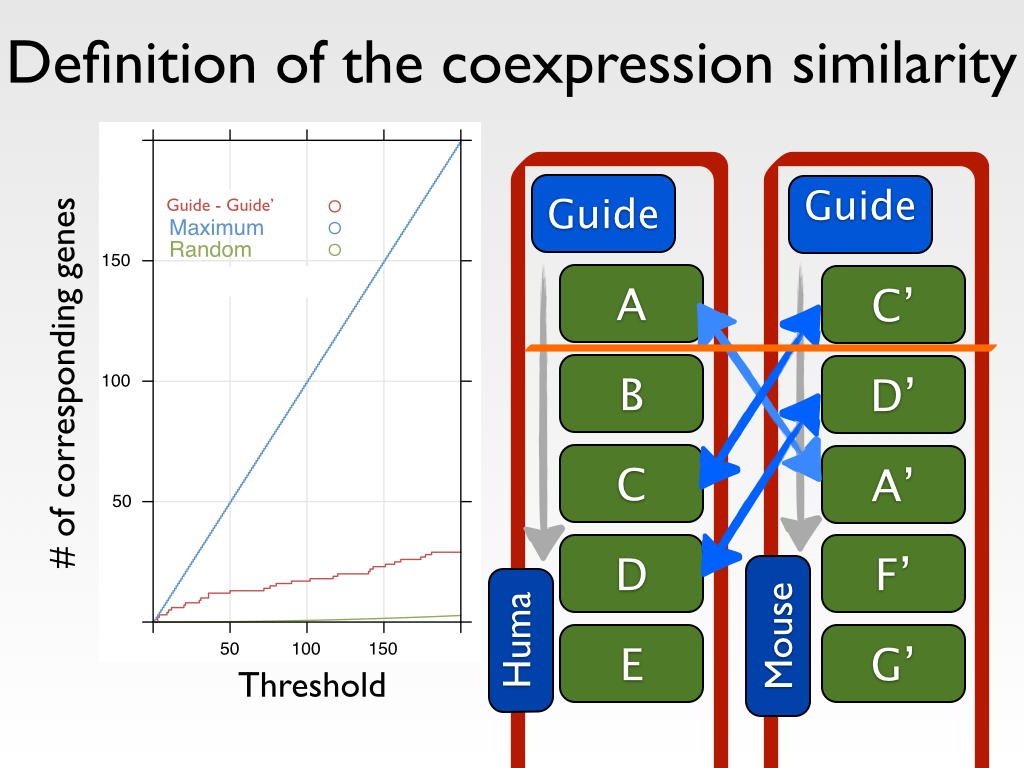
We introduced a similarity measure
COXSIM, which is the weighted concordance rate between the coexpressed gene listf from a guide gene
g of interest (
listg) and that from a reference guide gene
r (
listr).
COXSIM is a function of guide gene
g, guide gene
r and threshold k.

, where n(
i,
listg,
listr) is the number of common genes (orthologous genes in the case using platforms in different species) found in the top
i coexpressed gene lists.
Excluding orphan genes for the gene list comparison
However, there are genes in a platform for
listg that do not have corresponding genes in a platform for
listr. When such genes appear at high ranks in
listg, the coincidence of the two lists decreases. To avoid the effect of the absence of the corresponding genes in the reference platform, genes that lack corresponding genes in the reference platform are excluded from
listg, leaving
listg→r. In the same way, genes in
listr that lack corresponding genes in
listg are excluded, resulting
listr→g. Subsequently, we examined the top
k coexpressed genes in
listg→r with the reference gene list,
listr→g.

Selection of k
As
k, we use 1% of the number of the genes in
listg→r.
We previously used 100 for k, meaning that we checked the gene correspondence of the top 100 coexpressed genes, in accordance with the default representation of a coexpressed gene list on COXPRESdb.
However, the use of a common threshold for all platforms causes different stringencies of the coexpression thresholds.
For example, the Sce platform for S. cerevisiae has 4,461 genes for coexpression analysis, whereas the Hsa platform for human has 19,803 genes. The former has four to five times higher probability to randomly include a particular gene in the top k rank, and thus overestimates the significance for the coincidence of the gene lists. Therefore, we have modified the number of genes from the top k to the top 1% of all genes in listg→r.
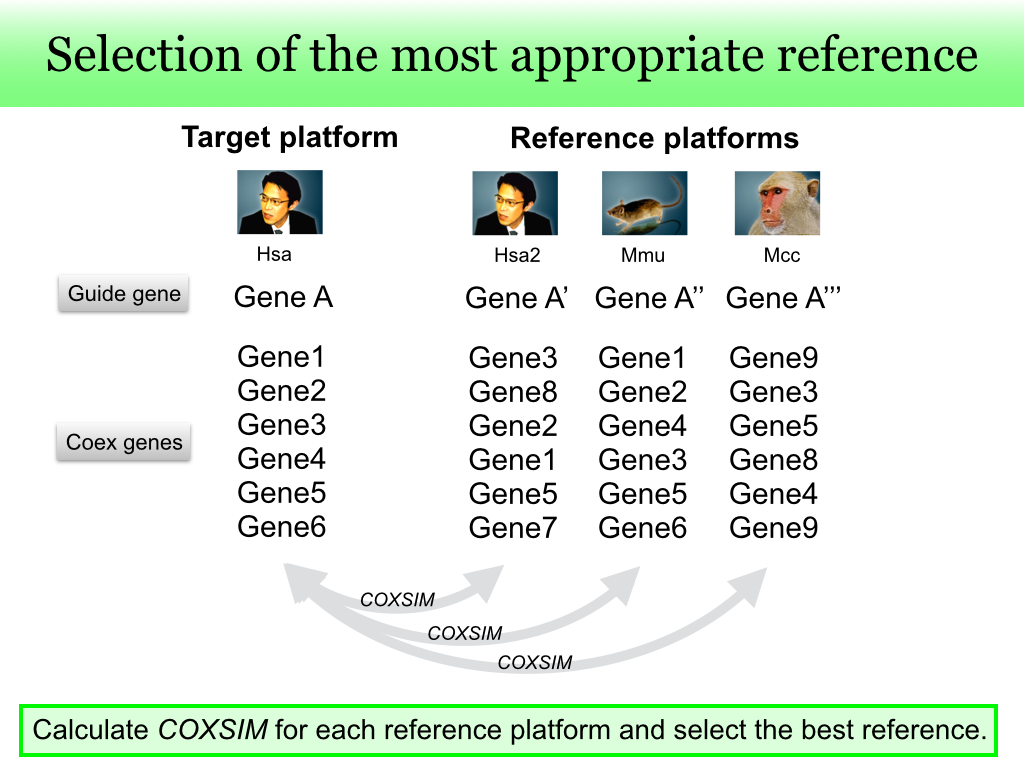
Since the best reference guide gene is unknown, we checked all possible reference guide genes. The reference guide gene set
R is composed of all available orthologous genes for different species. When multiple platforms are available for the species including the guide gene
g, the same gene in the other platforms is also included in the reference guide gene set
R.
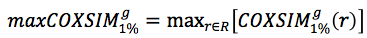
The
COXSIM values are calculated between the target guide gene
g and every reference gene
r in
R. The reference gene
rmax that gives the maximum
COXSIM value is regarded as the best reference guide gene.
On the ATTED-II, the significance level, which we call the
supportability, is shown as the number of stars according to the following
p-value threshold.
| p-value threshold | Representation |
|---|
| 1E-01 | ☆ |
| 1E-02 | ☆☆ |
| 1E-03 | ☆☆☆ |