DNA microarray analysis produces information on relative expression levels for thousands of genes simultaneously. In addition, large collections of microarray data contain information about concerted changes in transcript levels in these datasets beyond the original purpose of each dataset.
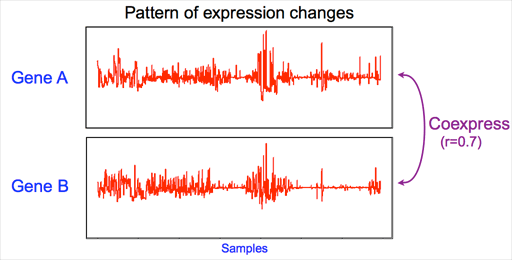
Using the pattern of gene expression changes between two genes of interest, similarity of expression (also called as "gene coexpression") can be defined. Usually, Pearson's correlation coefficient is used as a measure of gene coexpression. "1" indicates strong relationship in an aspect of gene expression regulation, "0" indicates no relationship.
In the case of the right example, the two genes relatively strongly coexpress. The degree of coexpression is measured by pearson's correlation r = 0.7.

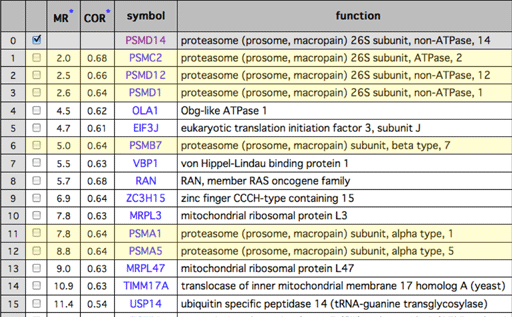
Gene coexpression is defined between two genes of interest. So coexpressed genes can be searched for one query genes. As an example of such coexpressed gene list, we show the coexpressed gene list for PSMD14, one of the proteasome complex subunits. Since subunits of complex protein basically regulated in similar manner, the subunits can be searched using gene coexpression information. Actually in this example, other proteasome subunits can be found in the coexpressed gene list.
Genes for protein complex generally show strong gene coexpression.

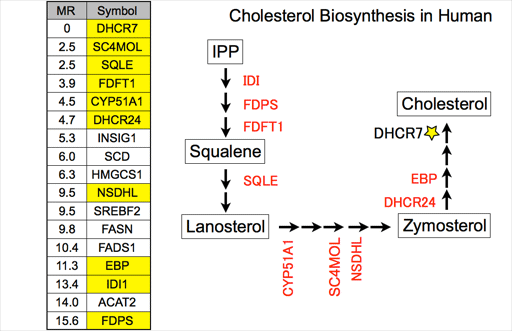
In this example, we use DHCR7 that codes one of the cholesterol biosynthesis enzymes. Cholesterol biosynthesis is long metabolic pathway including many enzymes. However when we use the DHCR7 as seed genes to search other enzymes in this metabolic pathway, most of the other enzymes can be searched by gene coexpression. In the left table, the top line indicates the query gene, and next lines indicate the most strongly coexpressed genes. "MR" is a coexpression measure used in our databases.

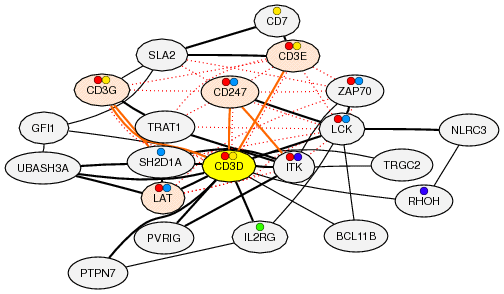
Gene coexpression provides us powerful information to identify new gene functionally related. However this coexpression relationship only reflects mRNA-level regulation and not reflects protein-level regulation, indicating that coexpression information is not effective if the target gene system is not regulated at mRNA-level. Therefore, we integrate known protein-protein-interaction information on coexpressed gene network. Gene coexpression and protein-protein-interaction indicate other layer of regulation, and thus complementary information to understand gene function network. On the coexpressed gene network, solid edges indicate gene coexpression, and red dotted edges indicate known protein-protein-interaction.
We are developing two databases to easily use such gene coexpression information especially for experimental biologist.
These are similar coexpression databases developed by other researchers:
Please check following reviews for experimental researchers to use gene coexpression.